Cypriot vs Immigrants from Central America 3 or more Vehicles in Household
COMPARE
Cypriot
Immigrants from Central America
3 or more Vehicles in Household
3 or more Vehicles in Household Comparison
Cypriots
Immigrants from Central America
16.6%
3 OR MORE VEHICLES IN HOUSEHOLD
0.0/ 100
METRIC RATING
300th/ 347
METRIC RANK
23.4%
3 OR MORE VEHICLES IN HOUSEHOLD
100.0/ 100
METRIC RATING
25th/ 347
METRIC RANK
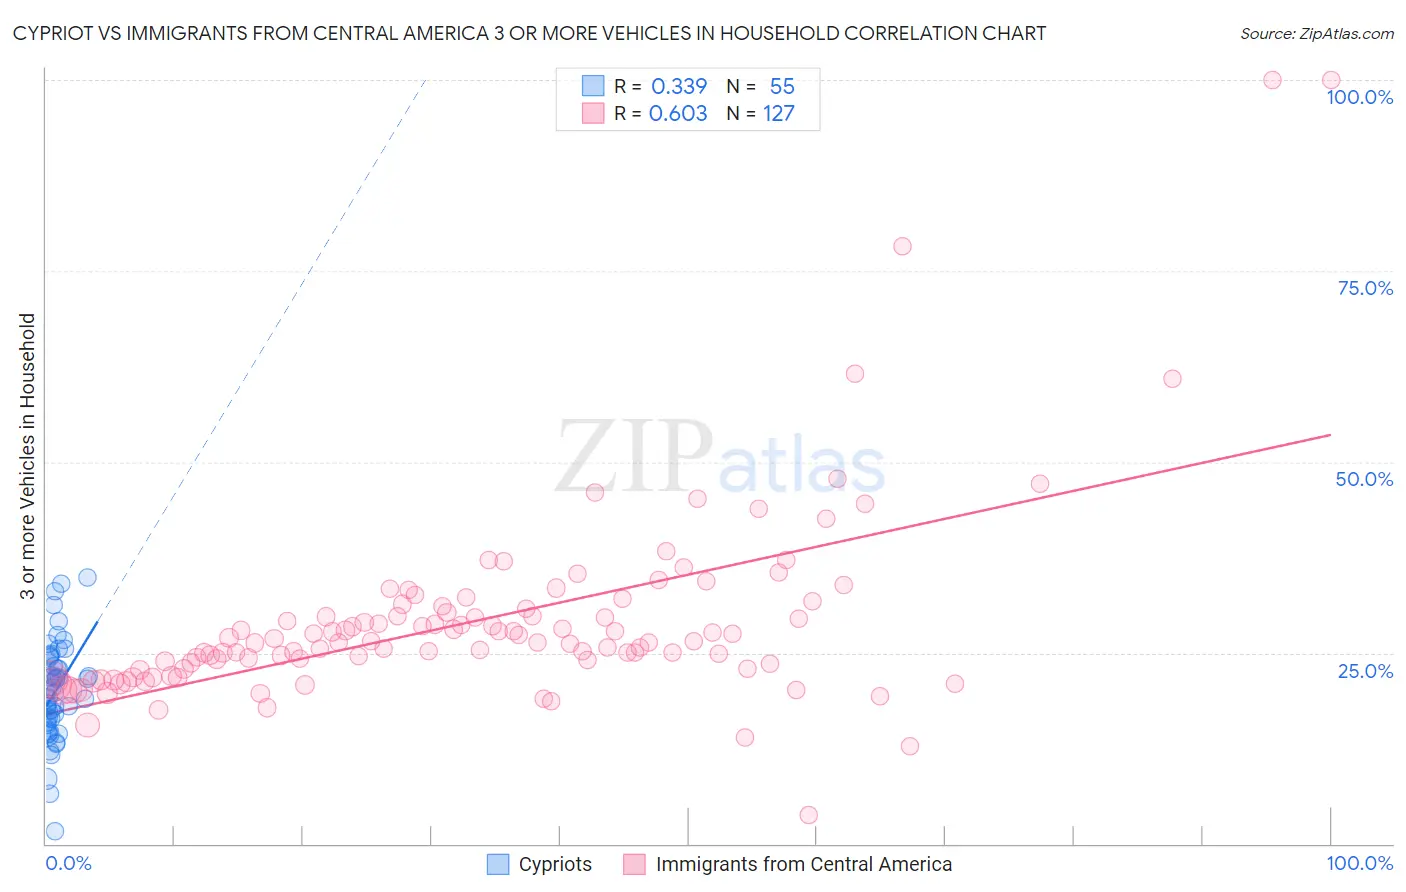
Cypriot vs Immigrants from Central America 3 or more Vehicles in Household Correlation Chart
The statistical analysis conducted on geographies consisting of 61,836,618 people shows a mild positive correlation between the proportion of Cypriots and percentage of households with 3 or more vehicles available in the United States with a correlation coefficient (R) of 0.339 and weighted average of 16.6%. Similarly, the statistical analysis conducted on geographies consisting of 535,876,372 people shows a significant positive correlation between the proportion of Immigrants from Central America and percentage of households with 3 or more vehicles available in the United States with a correlation coefficient (R) of 0.603 and weighted average of 23.4%, a difference of 41.0%.
3 or more Vehicles in Household Correlation Summary
| Measurement | Cypriot | Immigrants from Central America |
| Minimum | 1.6% | 3.8% |
| Maximum | 34.9% | 100.0% |
| Range | 33.3% | 96.2% |
| Mean | 20.0% | 29.1% |
| Median | 19.9% | 26.4% |
| Interquartile 25% (IQ1) | 15.8% | 22.9% |
| Interquartile 75% (IQ3) | 24.3% | 30.8% |
| Interquartile Range (IQR) | 8.5% | 7.9% |
| Standard Deviation (Sample) | 6.5% | 12.9% |
| Standard Deviation (Population) | 6.4% | 12.9% |
Similar Demographics by 3 or more Vehicles in Household
Demographics Similar to Cypriots by 3 or more Vehicles in Household
In terms of 3 or more vehicles in household, the demographic groups most similar to Cypriots are Paraguayan (16.6%, a difference of 0.41%), Immigrants from South America (16.7%, a difference of 0.48%), Immigrants from Zaire (16.7%, a difference of 0.54%), Immigrants from Greece (16.5%, a difference of 0.83%), and Israeli (16.8%, a difference of 0.91%).
| Demographics | Rating | Rank | 3 or more Vehicles in Household |
| Bahamians | 0.1 /100 | #293 | Tragic 16.9% |
| Immigrants | Western Africa | 0.1 /100 | #294 | Tragic 16.9% |
| Immigrants | Russia | 0.1 /100 | #295 | Tragic 16.9% |
| Inupiat | 0.1 /100 | #296 | Tragic 16.9% |
| Israelis | 0.1 /100 | #297 | Tragic 16.8% |
| Immigrants | Zaire | 0.1 /100 | #298 | Tragic 16.7% |
| Immigrants | South America | 0.1 /100 | #299 | Tragic 16.7% |
| Cypriots | 0.0 /100 | #300 | Tragic 16.6% |
| Paraguayans | 0.0 /100 | #301 | Tragic 16.6% |
| Immigrants | Greece | 0.0 /100 | #302 | Tragic 16.5% |
| Immigrants | Serbia | 0.0 /100 | #303 | Tragic 16.4% |
| Ghanaians | 0.0 /100 | #304 | Tragic 16.4% |
| Immigrants | Morocco | 0.0 /100 | #305 | Tragic 16.3% |
| Somalis | 0.0 /100 | #306 | Tragic 16.2% |
| Immigrants | Ghana | 0.0 /100 | #307 | Tragic 16.2% |
Demographics Similar to Immigrants from Central America by 3 or more Vehicles in Household
In terms of 3 or more vehicles in household, the demographic groups most similar to Immigrants from Central America are Sri Lankan (23.6%, a difference of 0.51%), Scandinavian (23.6%, a difference of 0.77%), Mexican American Indian (23.3%, a difference of 0.77%), Guamanian/Chamorro (23.2%, a difference of 0.91%), and Lumbee (23.1%, a difference of 1.2%).
| Demographics | Rating | Rank | 3 or more Vehicles in Household |
| Norwegians | 100.0 /100 | #18 | Exceptional 23.9% |
| Chinese | 100.0 /100 | #19 | Exceptional 23.9% |
| Paiute | 100.0 /100 | #20 | Exceptional 23.8% |
| Immigrants | Vietnam | 100.0 /100 | #21 | Exceptional 23.8% |
| Immigrants | Philippines | 100.0 /100 | #22 | Exceptional 23.8% |
| Scandinavians | 100.0 /100 | #23 | Exceptional 23.6% |
| Sri Lankans | 100.0 /100 | #24 | Exceptional 23.6% |
| Immigrants | Central America | 100.0 /100 | #25 | Exceptional 23.4% |
| Mexican American Indians | 100.0 /100 | #26 | Exceptional 23.3% |
| Guamanians/Chamorros | 100.0 /100 | #27 | Exceptional 23.2% |
| Lumbee | 100.0 /100 | #28 | Exceptional 23.1% |
| Spanish | 100.0 /100 | #29 | Exceptional 23.1% |
| Immigrants | South Eastern Asia | 100.0 /100 | #30 | Exceptional 23.1% |
| English | 100.0 /100 | #31 | Exceptional 23.1% |
| Pueblo | 100.0 /100 | #32 | Exceptional 23.0% |