Vietnamese vs Immigrants from Lebanon 3 or more Vehicles in Household
COMPARE
Vietnamese
Immigrants from Lebanon
3 or more Vehicles in Household
3 or more Vehicles in Household Comparison
Vietnamese
Immigrants from Lebanon
12.5%
3 OR MORE VEHICLES IN HOUSEHOLD
0.0/ 100
METRIC RATING
338th/ 347
METRIC RANK
19.8%
3 OR MORE VEHICLES IN HOUSEHOLD
67.6/ 100
METRIC RATING
160th/ 347
METRIC RANK
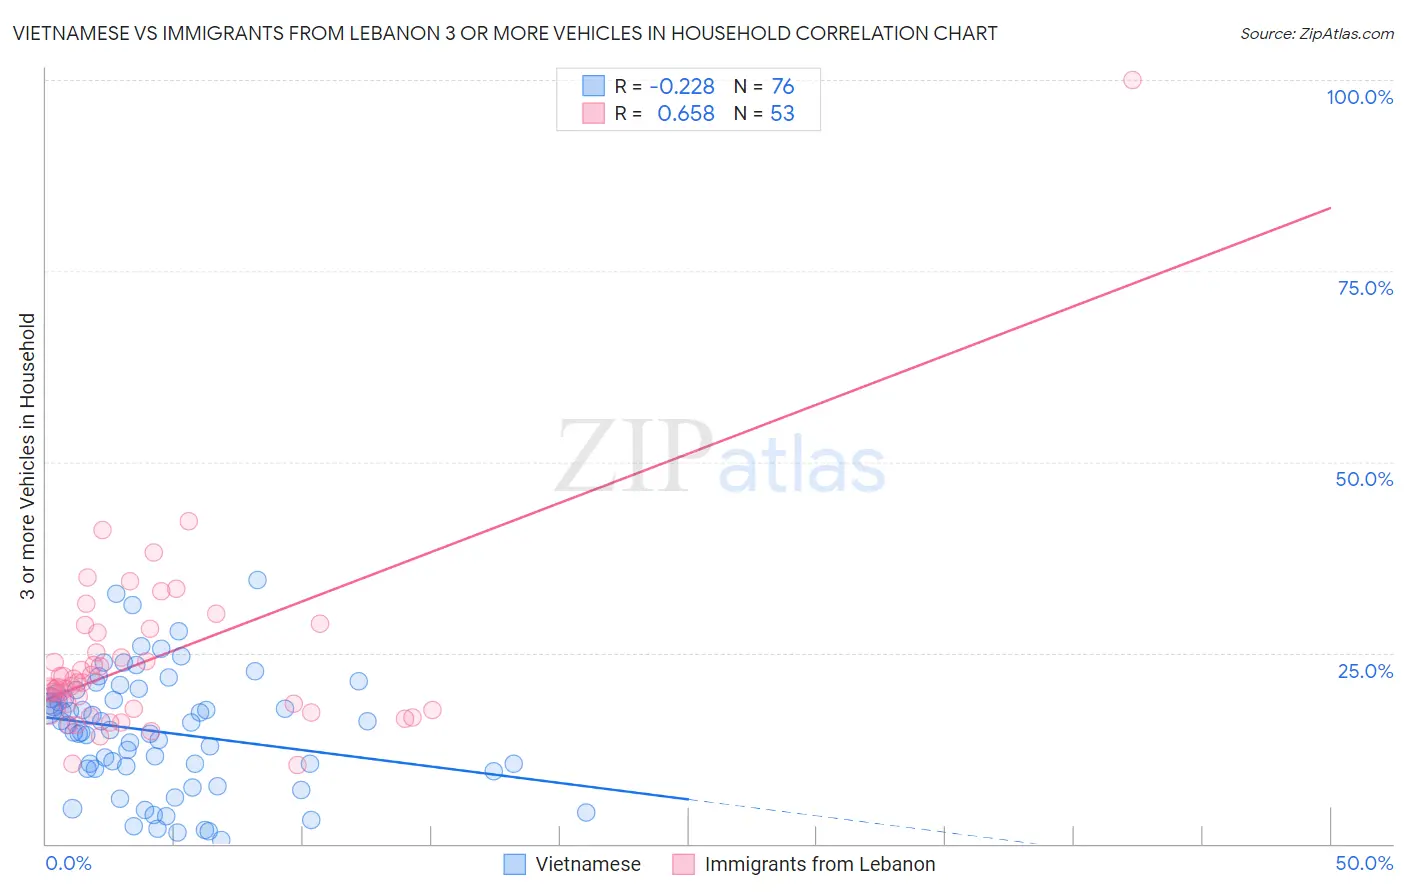
Vietnamese vs Immigrants from Lebanon 3 or more Vehicles in Household Correlation Chart
The statistical analysis conducted on geographies consisting of 170,612,535 people shows a weak negative correlation between the proportion of Vietnamese and percentage of households with 3 or more vehicles available in the United States with a correlation coefficient (R) of -0.228 and weighted average of 12.5%. Similarly, the statistical analysis conducted on geographies consisting of 217,088,415 people shows a significant positive correlation between the proportion of Immigrants from Lebanon and percentage of households with 3 or more vehicles available in the United States with a correlation coefficient (R) of 0.658 and weighted average of 19.8%, a difference of 58.8%.
3 or more Vehicles in Household Correlation Summary
| Measurement | Vietnamese | Immigrants from Lebanon |
| Minimum | 0.43% | 10.3% |
| Maximum | 34.6% | 100.0% |
| Range | 34.1% | 89.7% |
| Mean | 14.7% | 24.1% |
| Median | 15.2% | 21.1% |
| Interquartile 25% (IQ1) | 9.9% | 17.5% |
| Interquartile 75% (IQ3) | 19.4% | 27.9% |
| Interquartile Range (IQR) | 9.6% | 10.4% |
| Standard Deviation (Sample) | 7.8% | 12.8% |
| Standard Deviation (Population) | 7.7% | 12.7% |
Similar Demographics by 3 or more Vehicles in Household
Demographics Similar to Vietnamese by 3 or more Vehicles in Household
In terms of 3 or more vehicles in household, the demographic groups most similar to Vietnamese are Immigrants from Bangladesh (12.5%, a difference of 0.54%), Barbadian (12.6%, a difference of 0.98%), Immigrants from Uzbekistan (12.0%, a difference of 3.9%), Immigrants from Barbados (11.7%, a difference of 6.2%), and Immigrants from Trinidad and Tobago (13.3%, a difference of 7.1%).
| Demographics | Rating | Rank | 3 or more Vehicles in Household |
| Immigrants | Dominica | 0.0 /100 | #331 | Tragic 13.7% |
| Trinidadians and Tobagonians | 0.0 /100 | #332 | Tragic 13.6% |
| Immigrants | Cabo Verde | 0.0 /100 | #333 | Tragic 13.6% |
| Immigrants | Ecuador | 0.0 /100 | #334 | Tragic 13.4% |
| Immigrants | Trinidad and Tobago | 0.0 /100 | #335 | Tragic 13.3% |
| Barbadians | 0.0 /100 | #336 | Tragic 12.6% |
| Immigrants | Bangladesh | 0.0 /100 | #337 | Tragic 12.5% |
| Vietnamese | 0.0 /100 | #338 | Tragic 12.5% |
| Immigrants | Uzbekistan | 0.0 /100 | #339 | Tragic 12.0% |
| Immigrants | Barbados | 0.0 /100 | #340 | Tragic 11.7% |
| Guyanese | 0.0 /100 | #341 | Tragic 11.5% |
| British West Indians | 0.0 /100 | #342 | Tragic 11.4% |
| Immigrants | Guyana | 0.0 /100 | #343 | Tragic 11.2% |
| Dominicans | 0.0 /100 | #344 | Tragic 11.2% |
| Immigrants | Dominican Republic | 0.0 /100 | #345 | Tragic 10.4% |
Demographics Similar to Immigrants from Lebanon by 3 or more Vehicles in Household
In terms of 3 or more vehicles in household, the demographic groups most similar to Immigrants from Lebanon are Immigrants from Pakistan (19.8%, a difference of 0.050%), Armenian (19.8%, a difference of 0.11%), Immigrants from Guatemala (19.7%, a difference of 0.16%), Hungarian (19.8%, a difference of 0.26%), and Thai (19.8%, a difference of 0.31%).
| Demographics | Rating | Rank | 3 or more Vehicles in Household |
| Yuman | 75.6 /100 | #153 | Good 19.9% |
| Immigrants | Jordan | 75.0 /100 | #154 | Good 19.9% |
| Tlingit-Haida | 73.4 /100 | #155 | Good 19.9% |
| Thais | 71.1 /100 | #156 | Good 19.8% |
| Hungarians | 70.5 /100 | #157 | Good 19.8% |
| Armenians | 68.8 /100 | #158 | Good 19.8% |
| Immigrants | Pakistan | 68.2 /100 | #159 | Good 19.8% |
| Immigrants | Lebanon | 67.6 /100 | #160 | Good 19.8% |
| Immigrants | Guatemala | 65.6 /100 | #161 | Good 19.7% |
| Estonians | 63.2 /100 | #162 | Good 19.7% |
| Chileans | 63.0 /100 | #163 | Good 19.7% |
| Yugoslavians | 62.9 /100 | #164 | Good 19.7% |
| Immigrants | Costa Rica | 61.9 /100 | #165 | Good 19.7% |
| Immigrants | Cameroon | 60.9 /100 | #166 | Good 19.7% |
| Ukrainians | 58.9 /100 | #167 | Average 19.6% |