Puget Sound Salish vs Alaskan Athabascan 3 or more Vehicles in Household
COMPARE
Puget Sound Salish
Alaskan Athabascan
3 or more Vehicles in Household
3 or more Vehicles in Household Comparison
Puget Sound Salish
Alaskan Athabascans
26.4%
3 OR MORE VEHICLES IN HOUSEHOLD
100.0/ 100
METRIC RATING
5th/ 347
METRIC RANK
21.9%
3 OR MORE VEHICLES IN HOUSEHOLD
99.9/ 100
METRIC RATING
67th/ 347
METRIC RANK
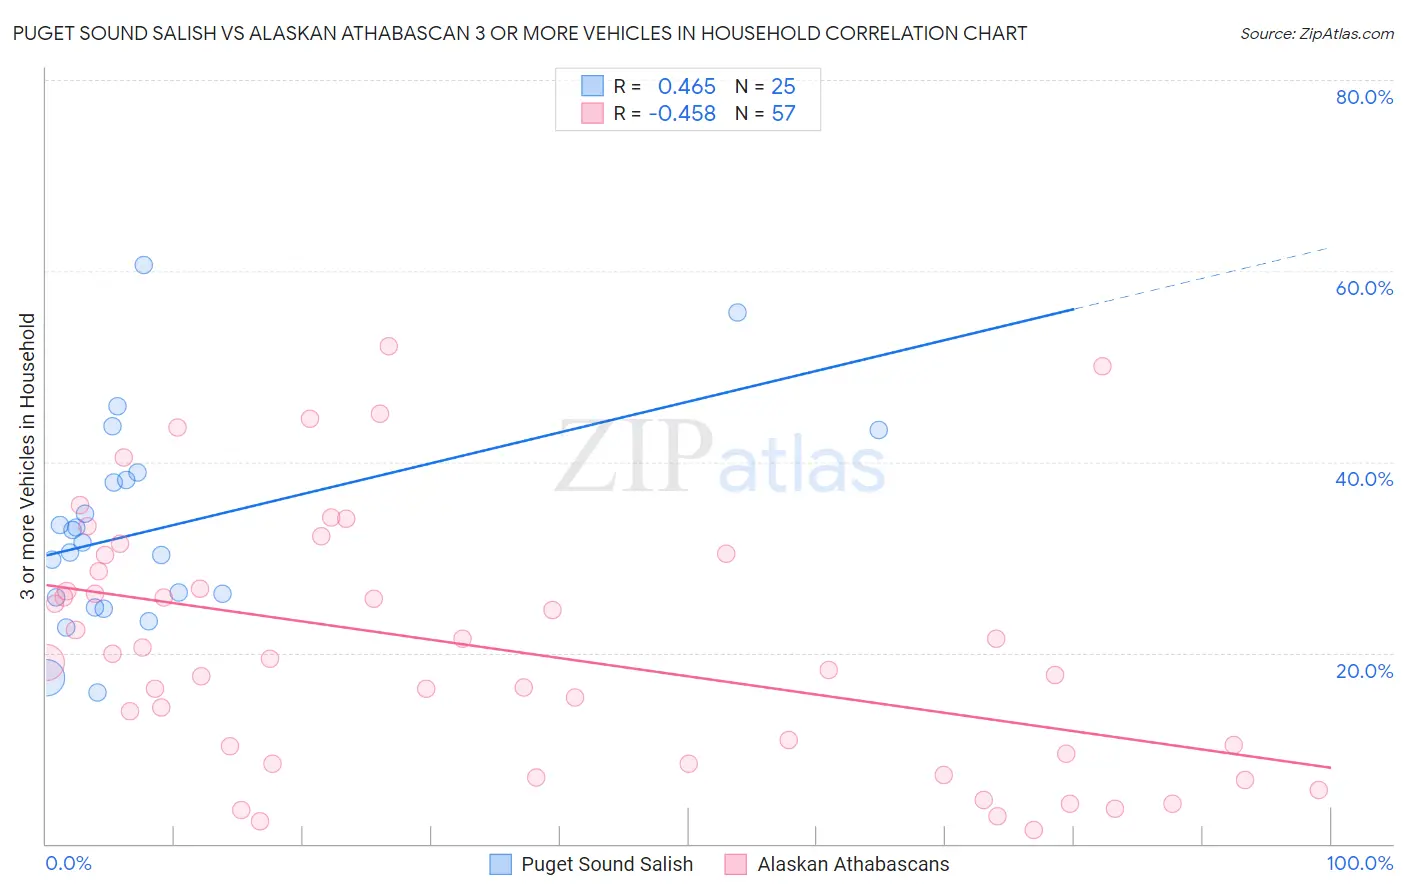
Puget Sound Salish vs Alaskan Athabascan 3 or more Vehicles in Household Correlation Chart
The statistical analysis conducted on geographies consisting of 46,155,628 people shows a moderate positive correlation between the proportion of Puget Sound Salish and percentage of households with 3 or more vehicles available in the United States with a correlation coefficient (R) of 0.465 and weighted average of 26.4%. Similarly, the statistical analysis conducted on geographies consisting of 45,796,078 people shows a moderate negative correlation between the proportion of Alaskan Athabascans and percentage of households with 3 or more vehicles available in the United States with a correlation coefficient (R) of -0.458 and weighted average of 21.9%, a difference of 20.1%.
3 or more Vehicles in Household Correlation Summary
| Measurement | Puget Sound Salish | Alaskan Athabascan |
| Minimum | 15.8% | 1.4% |
| Maximum | 60.7% | 52.1% |
| Range | 44.8% | 50.7% |
| Mean | 33.1% | 20.6% |
| Median | 31.6% | 19.4% |
| Interquartile 25% (IQ1) | 25.3% | 8.9% |
| Interquartile 75% (IQ3) | 38.5% | 29.4% |
| Interquartile Range (IQR) | 13.2% | 20.5% |
| Standard Deviation (Sample) | 10.8% | 13.0% |
| Standard Deviation (Population) | 10.6% | 12.9% |
Similar Demographics by 3 or more Vehicles in Household
Demographics Similar to Puget Sound Salish by 3 or more Vehicles in Household
In terms of 3 or more vehicles in household, the demographic groups most similar to Puget Sound Salish are Arapaho (26.4%, a difference of 0.34%), Tongan (26.5%, a difference of 0.67%), Immigrants from Fiji (26.1%, a difference of 1.2%), Spanish American Indian (26.9%, a difference of 2.2%), and Colville (25.8%, a difference of 2.3%).
| Demographics | Rating | Rank | 3 or more Vehicles in Household |
| Yakama | 100.0 /100 | #1 | Exceptional 31.0% |
| Spanish American Indians | 100.0 /100 | #2 | Exceptional 26.9% |
| Tongans | 100.0 /100 | #3 | Exceptional 26.5% |
| Arapaho | 100.0 /100 | #4 | Exceptional 26.4% |
| Puget Sound Salish | 100.0 /100 | #5 | Exceptional 26.4% |
| Immigrants | Fiji | 100.0 /100 | #6 | Exceptional 26.1% |
| Colville | 100.0 /100 | #7 | Exceptional 25.8% |
| Samoans | 100.0 /100 | #8 | Exceptional 25.0% |
| Native Hawaiians | 100.0 /100 | #9 | Exceptional 24.9% |
| Nepalese | 100.0 /100 | #10 | Exceptional 24.9% |
| Shoshone | 100.0 /100 | #11 | Exceptional 24.9% |
| Danes | 100.0 /100 | #12 | Exceptional 24.7% |
| Mexicans | 100.0 /100 | #13 | Exceptional 24.7% |
| Immigrants | Mexico | 100.0 /100 | #14 | Exceptional 24.6% |
| Hawaiians | 100.0 /100 | #15 | Exceptional 24.3% |
Demographics Similar to Alaskan Athabascans by 3 or more Vehicles in Household
In terms of 3 or more vehicles in household, the demographic groups most similar to Alaskan Athabascans are British (21.9%, a difference of 0.15%), Creek (21.9%, a difference of 0.18%), Northern European (22.0%, a difference of 0.26%), Bangladeshi (21.9%, a difference of 0.37%), and Potawatomi (21.9%, a difference of 0.38%).
| Demographics | Rating | Rank | 3 or more Vehicles in Household |
| Finns | 99.9 /100 | #60 | Exceptional 22.3% |
| Bhutanese | 99.9 /100 | #61 | Exceptional 22.2% |
| Fijians | 99.9 /100 | #62 | Exceptional 22.2% |
| Chickasaw | 99.9 /100 | #63 | Exceptional 22.2% |
| Immigrants | Taiwan | 99.9 /100 | #64 | Exceptional 22.1% |
| Pima | 99.9 /100 | #65 | Exceptional 22.0% |
| Northern Europeans | 99.9 /100 | #66 | Exceptional 22.0% |
| Alaskan Athabascans | 99.9 /100 | #67 | Exceptional 21.9% |
| British | 99.9 /100 | #68 | Exceptional 21.9% |
| Creek | 99.9 /100 | #69 | Exceptional 21.9% |
| Bangladeshis | 99.8 /100 | #70 | Exceptional 21.9% |
| Potawatomi | 99.8 /100 | #71 | Exceptional 21.9% |
| Portuguese | 99.8 /100 | #72 | Exceptional 21.8% |
| Salvadorans | 99.8 /100 | #73 | Exceptional 21.8% |
| Immigrants | Oceania | 99.8 /100 | #74 | Exceptional 21.8% |