Austrian vs Alaskan Athabascan 3 or more Vehicles in Household
COMPARE
Austrian
Alaskan Athabascan
3 or more Vehicles in Household
3 or more Vehicles in Household Comparison
Austrians
Alaskan Athabascans
20.9%
3 OR MORE VEHICLES IN HOUSEHOLD
97.5/ 100
METRIC RATING
105th/ 347
METRIC RANK
21.9%
3 OR MORE VEHICLES IN HOUSEHOLD
99.9/ 100
METRIC RATING
67th/ 347
METRIC RANK
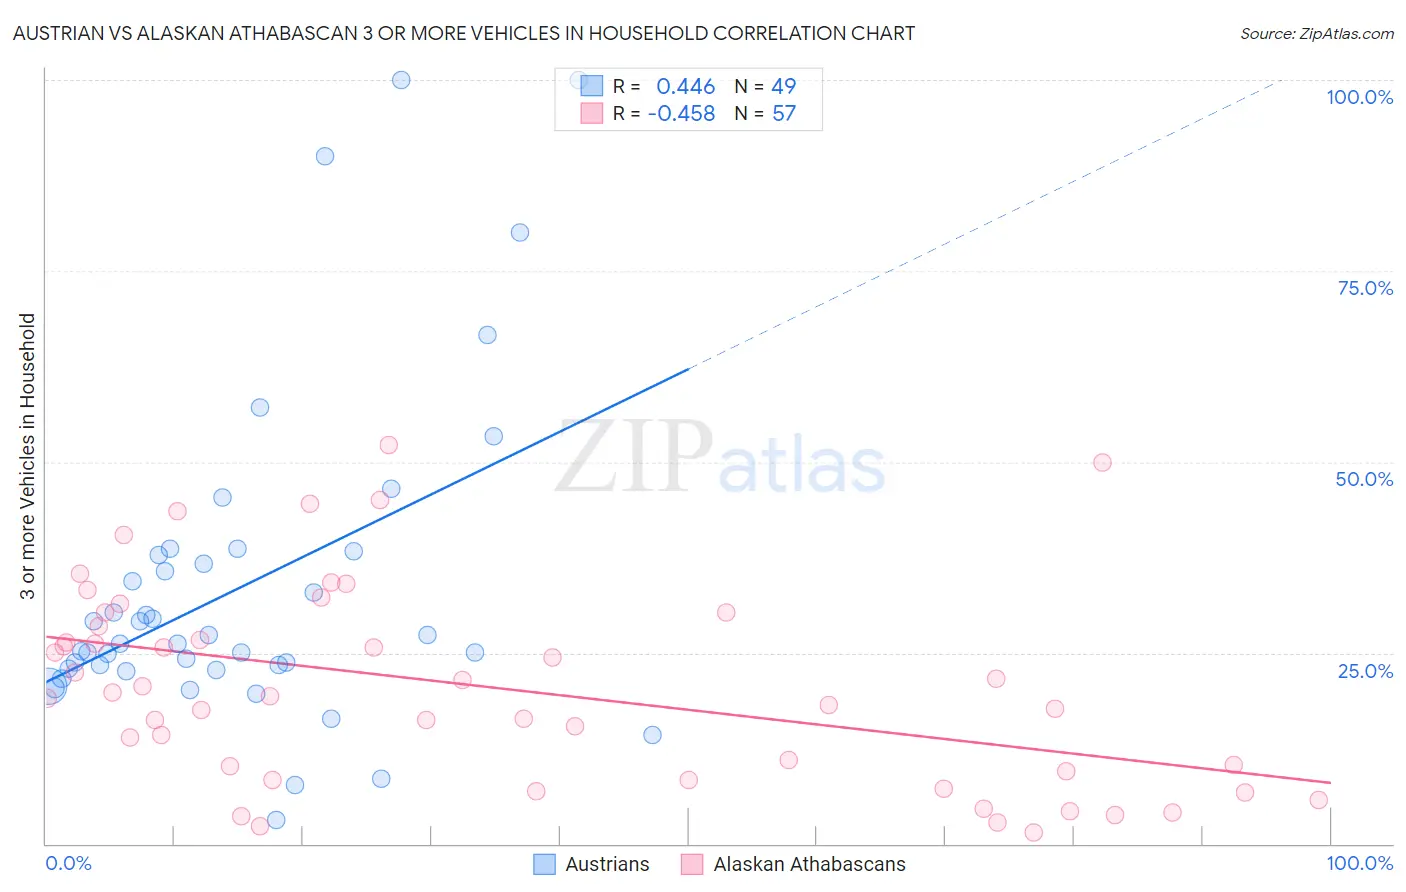
Austrian vs Alaskan Athabascan 3 or more Vehicles in Household Correlation Chart
The statistical analysis conducted on geographies consisting of 451,648,303 people shows a moderate positive correlation between the proportion of Austrians and percentage of households with 3 or more vehicles available in the United States with a correlation coefficient (R) of 0.446 and weighted average of 20.9%. Similarly, the statistical analysis conducted on geographies consisting of 45,796,078 people shows a moderate negative correlation between the proportion of Alaskan Athabascans and percentage of households with 3 or more vehicles available in the United States with a correlation coefficient (R) of -0.458 and weighted average of 21.9%, a difference of 5.2%.
3 or more Vehicles in Household Correlation Summary
| Measurement | Austrian | Alaskan Athabascan |
| Minimum | 3.1% | 1.4% |
| Maximum | 100.0% | 52.1% |
| Range | 96.9% | 50.7% |
| Mean | 33.7% | 20.6% |
| Median | 26.2% | 19.4% |
| Interquartile 25% (IQ1) | 22.8% | 8.9% |
| Interquartile 75% (IQ3) | 38.0% | 29.4% |
| Interquartile Range (IQR) | 15.2% | 20.5% |
| Standard Deviation (Sample) | 21.3% | 13.0% |
| Standard Deviation (Population) | 21.1% | 12.9% |
Similar Demographics by 3 or more Vehicles in Household
Demographics Similar to Austrians by 3 or more Vehicles in Household
In terms of 3 or more vehicles in household, the demographic groups most similar to Austrians are Bolivian (20.8%, a difference of 0.090%), Luxembourger (20.9%, a difference of 0.10%), Immigrants from Germany (20.8%, a difference of 0.13%), Dutch West Indian (20.9%, a difference of 0.19%), and Seminole (20.9%, a difference of 0.23%).
| Demographics | Rating | Rank | 3 or more Vehicles in Household |
| Hmong | 98.2 /100 | #98 | Exceptional 21.0% |
| Alaska Natives | 98.2 /100 | #99 | Exceptional 21.0% |
| Comanche | 98.2 /100 | #100 | Exceptional 21.0% |
| Blackfeet | 97.9 /100 | #101 | Exceptional 20.9% |
| Seminole | 97.8 /100 | #102 | Exceptional 20.9% |
| Dutch West Indians | 97.8 /100 | #103 | Exceptional 20.9% |
| Luxembourgers | 97.7 /100 | #104 | Exceptional 20.9% |
| Austrians | 97.5 /100 | #105 | Exceptional 20.9% |
| Bolivians | 97.4 /100 | #106 | Exceptional 20.8% |
| Immigrants | Germany | 97.4 /100 | #107 | Exceptional 20.8% |
| Immigrants | Scotland | 97.1 /100 | #108 | Exceptional 20.8% |
| Filipinos | 97.0 /100 | #109 | Exceptional 20.8% |
| Asians | 96.8 /100 | #110 | Exceptional 20.8% |
| Immigrants | Micronesia | 96.7 /100 | #111 | Exceptional 20.7% |
| Nicaraguans | 96.2 /100 | #112 | Exceptional 20.7% |
Demographics Similar to Alaskan Athabascans by 3 or more Vehicles in Household
In terms of 3 or more vehicles in household, the demographic groups most similar to Alaskan Athabascans are British (21.9%, a difference of 0.15%), Creek (21.9%, a difference of 0.18%), Northern European (22.0%, a difference of 0.26%), Bangladeshi (21.9%, a difference of 0.37%), and Potawatomi (21.9%, a difference of 0.38%).
| Demographics | Rating | Rank | 3 or more Vehicles in Household |
| Finns | 99.9 /100 | #60 | Exceptional 22.3% |
| Bhutanese | 99.9 /100 | #61 | Exceptional 22.2% |
| Fijians | 99.9 /100 | #62 | Exceptional 22.2% |
| Chickasaw | 99.9 /100 | #63 | Exceptional 22.2% |
| Immigrants | Taiwan | 99.9 /100 | #64 | Exceptional 22.1% |
| Pima | 99.9 /100 | #65 | Exceptional 22.0% |
| Northern Europeans | 99.9 /100 | #66 | Exceptional 22.0% |
| Alaskan Athabascans | 99.9 /100 | #67 | Exceptional 21.9% |
| British | 99.9 /100 | #68 | Exceptional 21.9% |
| Creek | 99.9 /100 | #69 | Exceptional 21.9% |
| Bangladeshis | 99.8 /100 | #70 | Exceptional 21.9% |
| Potawatomi | 99.8 /100 | #71 | Exceptional 21.9% |
| Portuguese | 99.8 /100 | #72 | Exceptional 21.8% |
| Salvadorans | 99.8 /100 | #73 | Exceptional 21.8% |
| Immigrants | Oceania | 99.8 /100 | #74 | Exceptional 21.8% |