Immigrants from Micronesia vs Immigrants from Senegal 3 or more Vehicles in Household
COMPARE
Immigrants from Micronesia
Immigrants from Senegal
3 or more Vehicles in Household
3 or more Vehicles in Household Comparison
Immigrants from Micronesia
Immigrants from Senegal
20.7%
3 OR MORE VEHICLES IN HOUSEHOLD
96.7/ 100
METRIC RATING
111th/ 347
METRIC RANK
13.8%
3 OR MORE VEHICLES IN HOUSEHOLD
0.0/ 100
METRIC RATING
329th/ 347
METRIC RANK
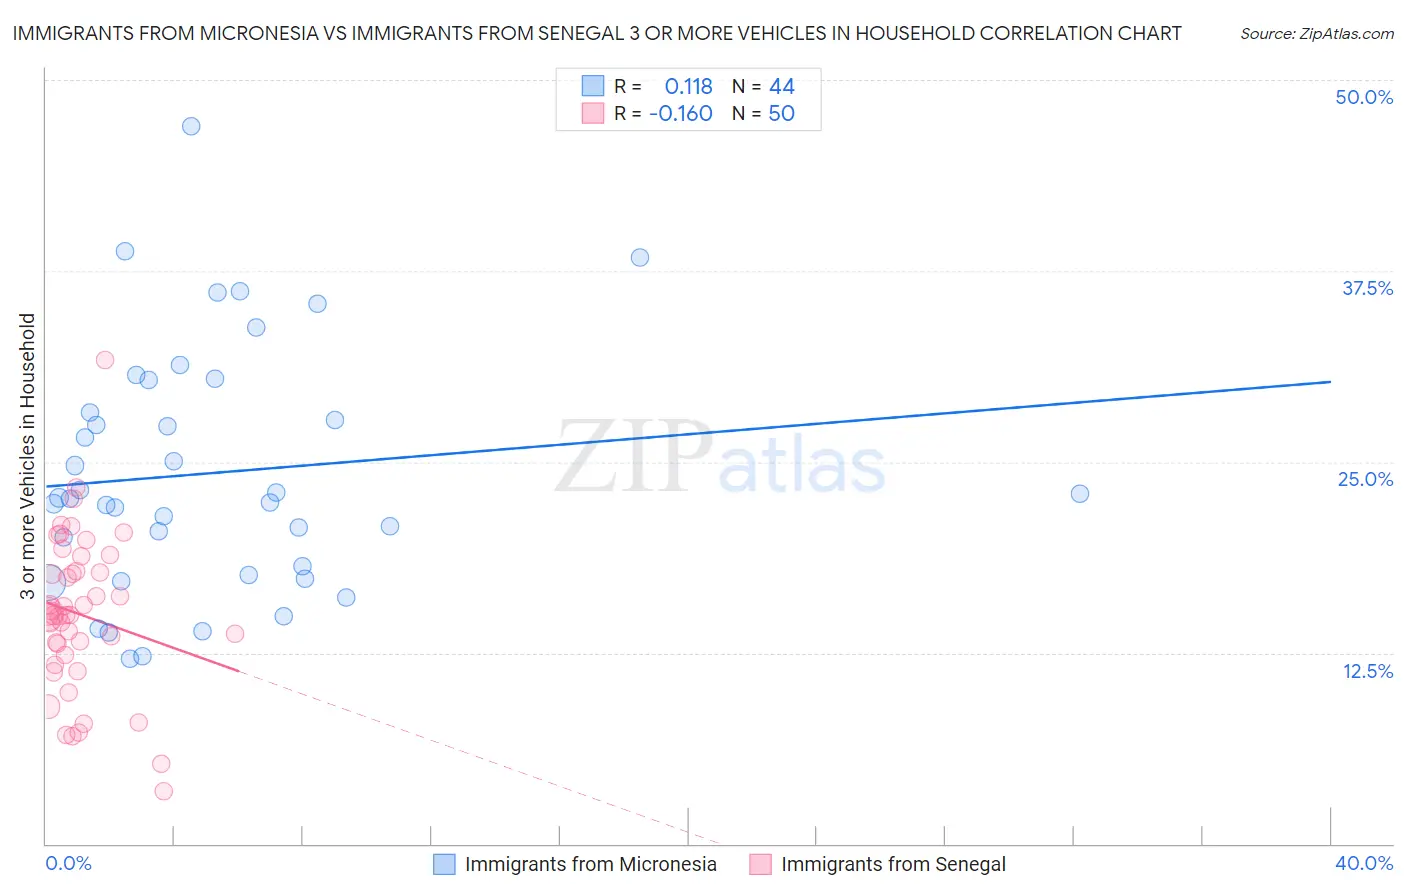
Immigrants from Micronesia vs Immigrants from Senegal 3 or more Vehicles in Household Correlation Chart
The statistical analysis conducted on geographies consisting of 61,601,070 people shows a poor positive correlation between the proportion of Immigrants from Micronesia and percentage of households with 3 or more vehicles available in the United States with a correlation coefficient (R) of 0.118 and weighted average of 20.7%. Similarly, the statistical analysis conducted on geographies consisting of 90,108,682 people shows a poor negative correlation between the proportion of Immigrants from Senegal and percentage of households with 3 or more vehicles available in the United States with a correlation coefficient (R) of -0.160 and weighted average of 13.8%, a difference of 50.4%.
3 or more Vehicles in Household Correlation Summary
| Measurement | Immigrants from Micronesia | Immigrants from Senegal |
| Minimum | 12.1% | 3.4% |
| Maximum | 47.0% | 31.7% |
| Range | 34.8% | 28.3% |
| Mean | 24.2% | 15.0% |
| Median | 22.6% | 15.0% |
| Interquartile 25% (IQ1) | 17.9% | 12.4% |
| Interquartile 75% (IQ3) | 29.3% | 17.8% |
| Interquartile Range (IQR) | 11.4% | 5.4% |
| Standard Deviation (Sample) | 8.0% | 5.2% |
| Standard Deviation (Population) | 7.9% | 5.1% |
Similar Demographics by 3 or more Vehicles in Household
Demographics Similar to Immigrants from Micronesia by 3 or more Vehicles in Household
In terms of 3 or more vehicles in household, the demographic groups most similar to Immigrants from Micronesia are Asian (20.8%, a difference of 0.030%), Filipino (20.8%, a difference of 0.17%), Immigrants from Scotland (20.8%, a difference of 0.23%), Nicaraguan (20.7%, a difference of 0.29%), and Immigrants from England (20.7%, a difference of 0.30%).
| Demographics | Rating | Rank | 3 or more Vehicles in Household |
| Luxembourgers | 97.7 /100 | #104 | Exceptional 20.9% |
| Austrians | 97.5 /100 | #105 | Exceptional 20.9% |
| Bolivians | 97.4 /100 | #106 | Exceptional 20.8% |
| Immigrants | Germany | 97.4 /100 | #107 | Exceptional 20.8% |
| Immigrants | Scotland | 97.1 /100 | #108 | Exceptional 20.8% |
| Filipinos | 97.0 /100 | #109 | Exceptional 20.8% |
| Asians | 96.8 /100 | #110 | Exceptional 20.8% |
| Immigrants | Micronesia | 96.7 /100 | #111 | Exceptional 20.7% |
| Nicaraguans | 96.2 /100 | #112 | Exceptional 20.7% |
| Immigrants | England | 96.2 /100 | #113 | Exceptional 20.7% |
| Burmese | 95.8 /100 | #114 | Exceptional 20.6% |
| French Canadians | 95.0 /100 | #115 | Exceptional 20.6% |
| Italians | 94.9 /100 | #116 | Exceptional 20.6% |
| Croatians | 94.9 /100 | #117 | Exceptional 20.6% |
| Costa Ricans | 94.6 /100 | #118 | Exceptional 20.6% |
Demographics Similar to Immigrants from Senegal by 3 or more Vehicles in Household
In terms of 3 or more vehicles in household, the demographic groups most similar to Immigrants from Senegal are West Indian (13.7%, a difference of 0.33%), Immigrants from Dominica (13.7%, a difference of 0.55%), Immigrants from Albania (14.0%, a difference of 1.2%), Trinidadian and Tobagonian (13.6%, a difference of 1.3%), and Immigrants from Cabo Verde (13.6%, a difference of 1.6%).
| Demographics | Rating | Rank | 3 or more Vehicles in Household |
| Immigrants | West Indies | 0.0 /100 | #322 | Tragic 14.6% |
| Immigrants | Caribbean | 0.0 /100 | #323 | Tragic 14.6% |
| Immigrants | Yemen | 0.0 /100 | #324 | Tragic 14.2% |
| Senegalese | 0.0 /100 | #325 | Tragic 14.2% |
| Soviet Union | 0.0 /100 | #326 | Tragic 14.2% |
| Ecuadorians | 0.0 /100 | #327 | Tragic 14.1% |
| Immigrants | Albania | 0.0 /100 | #328 | Tragic 14.0% |
| Immigrants | Senegal | 0.0 /100 | #329 | Tragic 13.8% |
| West Indians | 0.0 /100 | #330 | Tragic 13.7% |
| Immigrants | Dominica | 0.0 /100 | #331 | Tragic 13.7% |
| Trinidadians and Tobagonians | 0.0 /100 | #332 | Tragic 13.6% |
| Immigrants | Cabo Verde | 0.0 /100 | #333 | Tragic 13.6% |
| Immigrants | Ecuador | 0.0 /100 | #334 | Tragic 13.4% |
| Immigrants | Trinidad and Tobago | 0.0 /100 | #335 | Tragic 13.3% |
| Barbadians | 0.0 /100 | #336 | Tragic 12.6% |