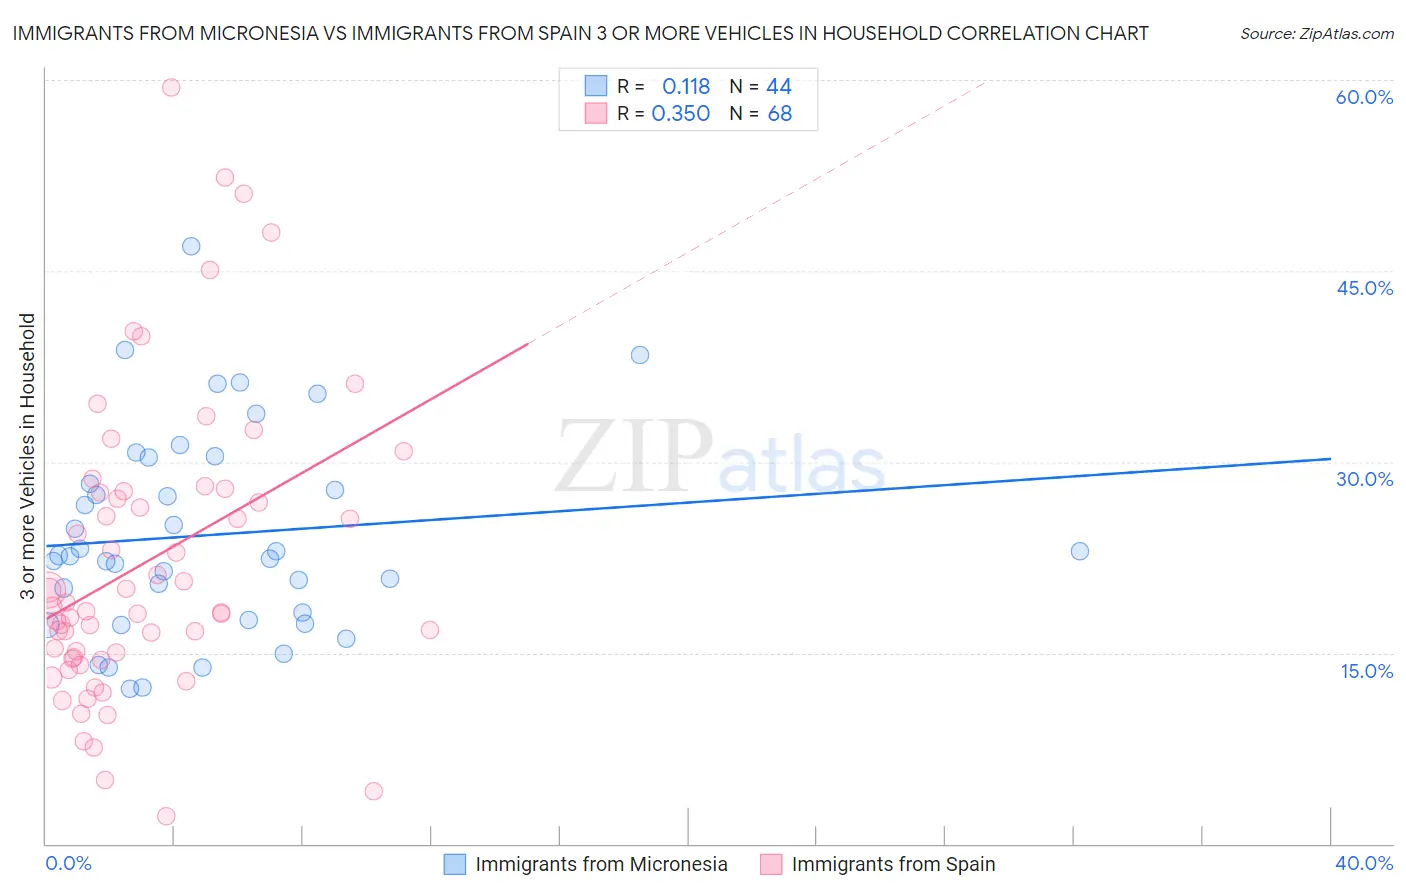
Immigrants from Micronesia vs Immigrants from Spain 3 or more Vehicles in Household
COMPARE
Immigrants from Micronesia
Immigrants from Spain
3 or more Vehicles in Household
3 or more Vehicles in Household Comparison
Immigrants from Micronesia
Immigrants from Spain
20.7%
3 OR MORE VEHICLES IN HOUSEHOLD
96.7/ 100
METRIC RATING
111th/ 347
METRIC RANK
17.0%
3 OR MORE VEHICLES IN HOUSEHOLD
0.1/ 100
METRIC RATING
292nd/ 347
METRIC RANK
Immigrants from Micronesia vs Immigrants from Spain 3 or more Vehicles in Household Correlation Chart
The statistical analysis conducted on geographies consisting of 61,601,070 people shows a poor positive correlation between the proportion of Immigrants from Micronesia and percentage of households with 3 or more vehicles available in the United States with a correlation coefficient (R) of 0.118 and weighted average of 20.7%. Similarly, the statistical analysis conducted on geographies consisting of 239,543,690 people shows a mild positive correlation between the proportion of Immigrants from Spain and percentage of households with 3 or more vehicles available in the United States with a correlation coefficient (R) of 0.350 and weighted average of 17.0%, a difference of 22.4%.
3 or more Vehicles in Household Correlation Summary
| Measurement | Immigrants from Micronesia | Immigrants from Spain |
| Minimum | 12.1% | 2.1% |
| Maximum | 47.0% | 59.4% |
| Range | 34.8% | 57.3% |
| Mean | 24.2% | 22.1% |
| Median | 22.6% | 18.4% |
| Interquartile 25% (IQ1) | 17.9% | 14.6% |
| Interquartile 75% (IQ3) | 29.3% | 27.6% |
| Interquartile Range (IQR) | 11.4% | 13.1% |
| Standard Deviation (Sample) | 8.0% | 11.7% |
| Standard Deviation (Population) | 7.9% | 11.6% |
Similar Demographics by 3 or more Vehicles in Household
Demographics Similar to Immigrants from Micronesia by 3 or more Vehicles in Household
In terms of 3 or more vehicles in household, the demographic groups most similar to Immigrants from Micronesia are Asian (20.8%, a difference of 0.030%), Filipino (20.8%, a difference of 0.17%), Immigrants from Scotland (20.8%, a difference of 0.23%), Nicaraguan (20.7%, a difference of 0.29%), and Immigrants from England (20.7%, a difference of 0.30%).
| Demographics | Rating | Rank | 3 or more Vehicles in Household |
| Luxembourgers | 97.7 /100 | #104 | Exceptional 20.9% |
| Austrians | 97.5 /100 | #105 | Exceptional 20.9% |
| Bolivians | 97.4 /100 | #106 | Exceptional 20.8% |
| Immigrants | Germany | 97.4 /100 | #107 | Exceptional 20.8% |
| Immigrants | Scotland | 97.1 /100 | #108 | Exceptional 20.8% |
| Filipinos | 97.0 /100 | #109 | Exceptional 20.8% |
| Asians | 96.8 /100 | #110 | Exceptional 20.8% |
| Immigrants | Micronesia | 96.7 /100 | #111 | Exceptional 20.7% |
| Nicaraguans | 96.2 /100 | #112 | Exceptional 20.7% |
| Immigrants | England | 96.2 /100 | #113 | Exceptional 20.7% |
| Burmese | 95.8 /100 | #114 | Exceptional 20.6% |
| French Canadians | 95.0 /100 | #115 | Exceptional 20.6% |
| Italians | 94.9 /100 | #116 | Exceptional 20.6% |
| Croatians | 94.9 /100 | #117 | Exceptional 20.6% |
| Costa Ricans | 94.6 /100 | #118 | Exceptional 20.6% |
Demographics Similar to Immigrants from Spain by 3 or more Vehicles in Household
In terms of 3 or more vehicles in household, the demographic groups most similar to Immigrants from Spain are Bahamian (16.9%, a difference of 0.080%), Immigrants from Congo (17.0%, a difference of 0.11%), Immigrants from Western Africa (16.9%, a difference of 0.20%), Immigrants from Russia (16.9%, a difference of 0.25%), and Liberian (17.0%, a difference of 0.27%).
| Demographics | Rating | Rank | 3 or more Vehicles in Household |
| Immigrants | Croatia | 0.2 /100 | #285 | Tragic 17.2% |
| Menominee | 0.2 /100 | #286 | Tragic 17.2% |
| Immigrants | Brazil | 0.2 /100 | #287 | Tragic 17.1% |
| Immigrants | Uruguay | 0.2 /100 | #288 | Tragic 17.1% |
| Immigrants | Liberia | 0.1 /100 | #289 | Tragic 17.1% |
| Liberians | 0.1 /100 | #290 | Tragic 17.0% |
| Immigrants | Congo | 0.1 /100 | #291 | Tragic 17.0% |
| Immigrants | Spain | 0.1 /100 | #292 | Tragic 17.0% |
| Bahamians | 0.1 /100 | #293 | Tragic 16.9% |
| Immigrants | Western Africa | 0.1 /100 | #294 | Tragic 16.9% |
| Immigrants | Russia | 0.1 /100 | #295 | Tragic 16.9% |
| Inupiat | 0.1 /100 | #296 | Tragic 16.9% |
| Israelis | 0.1 /100 | #297 | Tragic 16.8% |
| Immigrants | Zaire | 0.1 /100 | #298 | Tragic 16.7% |
| Immigrants | South America | 0.1 /100 | #299 | Tragic 16.7% |