Immigrants from Micronesia vs Arab 3 or more Vehicles in Household
COMPARE
Immigrants from Micronesia
Arab
3 or more Vehicles in Household
3 or more Vehicles in Household Comparison
Immigrants from Micronesia
Arabs
20.7%
3 OR MORE VEHICLES IN HOUSEHOLD
96.7/ 100
METRIC RATING
111th/ 347
METRIC RANK
18.9%
3 OR MORE VEHICLES IN HOUSEHOLD
17.7/ 100
METRIC RATING
201st/ 347
METRIC RANK
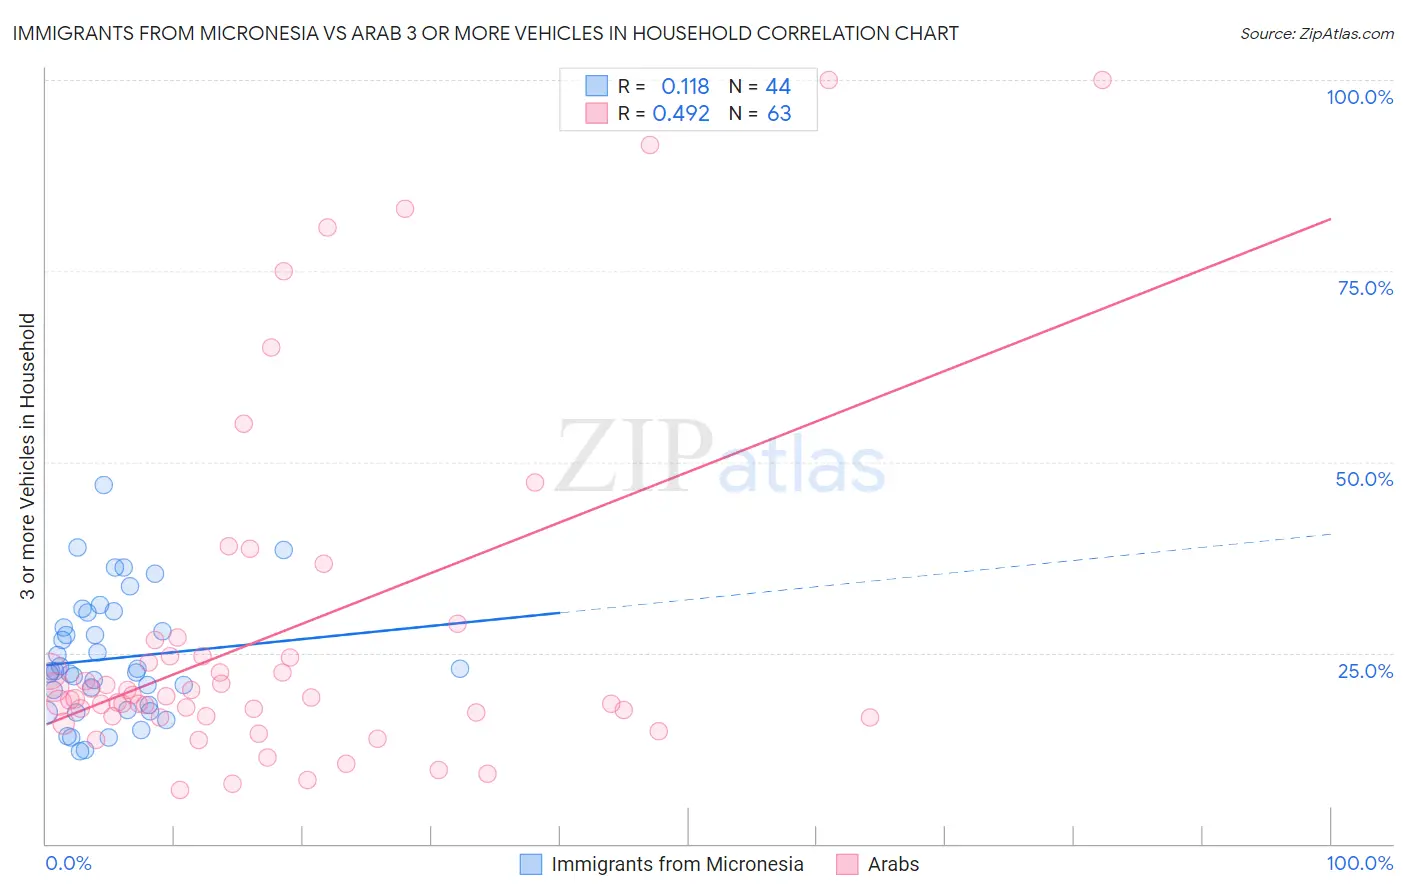
Immigrants from Micronesia vs Arab 3 or more Vehicles in Household Correlation Chart
The statistical analysis conducted on geographies consisting of 61,601,070 people shows a poor positive correlation between the proportion of Immigrants from Micronesia and percentage of households with 3 or more vehicles available in the United States with a correlation coefficient (R) of 0.118 and weighted average of 20.7%. Similarly, the statistical analysis conducted on geographies consisting of 486,191,468 people shows a moderate positive correlation between the proportion of Arabs and percentage of households with 3 or more vehicles available in the United States with a correlation coefficient (R) of 0.492 and weighted average of 18.9%, a difference of 9.6%.
3 or more Vehicles in Household Correlation Summary
| Measurement | Immigrants from Micronesia | Arab |
| Minimum | 12.1% | 7.1% |
| Maximum | 47.0% | 100.0% |
| Range | 34.8% | 92.9% |
| Mean | 24.2% | 27.5% |
| Median | 22.6% | 19.1% |
| Interquartile 25% (IQ1) | 17.9% | 16.7% |
| Interquartile 75% (IQ3) | 29.3% | 24.6% |
| Interquartile Range (IQR) | 11.4% | 7.9% |
| Standard Deviation (Sample) | 8.0% | 22.5% |
| Standard Deviation (Population) | 7.9% | 22.3% |
Similar Demographics by 3 or more Vehicles in Household
Demographics Similar to Immigrants from Micronesia by 3 or more Vehicles in Household
In terms of 3 or more vehicles in household, the demographic groups most similar to Immigrants from Micronesia are Asian (20.8%, a difference of 0.030%), Filipino (20.8%, a difference of 0.17%), Immigrants from Scotland (20.8%, a difference of 0.23%), Nicaraguan (20.7%, a difference of 0.29%), and Immigrants from England (20.7%, a difference of 0.30%).
| Demographics | Rating | Rank | 3 or more Vehicles in Household |
| Luxembourgers | 97.7 /100 | #104 | Exceptional 20.9% |
| Austrians | 97.5 /100 | #105 | Exceptional 20.9% |
| Bolivians | 97.4 /100 | #106 | Exceptional 20.8% |
| Immigrants | Germany | 97.4 /100 | #107 | Exceptional 20.8% |
| Immigrants | Scotland | 97.1 /100 | #108 | Exceptional 20.8% |
| Filipinos | 97.0 /100 | #109 | Exceptional 20.8% |
| Asians | 96.8 /100 | #110 | Exceptional 20.8% |
| Immigrants | Micronesia | 96.7 /100 | #111 | Exceptional 20.7% |
| Nicaraguans | 96.2 /100 | #112 | Exceptional 20.7% |
| Immigrants | England | 96.2 /100 | #113 | Exceptional 20.7% |
| Burmese | 95.8 /100 | #114 | Exceptional 20.6% |
| French Canadians | 95.0 /100 | #115 | Exceptional 20.6% |
| Italians | 94.9 /100 | #116 | Exceptional 20.6% |
| Croatians | 94.9 /100 | #117 | Exceptional 20.6% |
| Costa Ricans | 94.6 /100 | #118 | Exceptional 20.6% |
Demographics Similar to Arabs by 3 or more Vehicles in Household
In terms of 3 or more vehicles in household, the demographic groups most similar to Arabs are Argentinean (18.9%, a difference of 0.060%), Immigrants from Norway (19.0%, a difference of 0.16%), Egyptian (19.0%, a difference of 0.22%), Immigrants from Austria (18.9%, a difference of 0.33%), and Tohono O'odham (18.9%, a difference of 0.42%).
| Demographics | Rating | Rank | 3 or more Vehicles in Household |
| Serbians | 24.0 /100 | #194 | Fair 19.1% |
| Immigrants | Moldova | 23.6 /100 | #195 | Fair 19.1% |
| Central American Indians | 22.2 /100 | #196 | Fair 19.0% |
| Immigrants | Japan | 22.0 /100 | #197 | Fair 19.0% |
| Egyptians | 19.5 /100 | #198 | Poor 19.0% |
| Immigrants | Norway | 19.0 /100 | #199 | Poor 19.0% |
| Argentineans | 18.2 /100 | #200 | Poor 18.9% |
| Arabs | 17.7 /100 | #201 | Poor 18.9% |
| Immigrants | Austria | 15.4 /100 | #202 | Poor 18.9% |
| Tohono O'odham | 14.8 /100 | #203 | Poor 18.9% |
| Immigrants | Romania | 14.6 /100 | #204 | Poor 18.9% |
| Russians | 14.2 /100 | #205 | Poor 18.8% |
| Immigrants | Eastern Asia | 14.1 /100 | #206 | Poor 18.8% |
| Immigrants | Chile | 13.6 /100 | #207 | Poor 18.8% |
| Immigrants | Burma/Myanmar | 13.6 /100 | #208 | Poor 18.8% |