Black/African American vs Immigrants from Peru 3 or more Vehicles in Household
COMPARE
Black/African American
Immigrants from Peru
3 or more Vehicles in Household
3 or more Vehicles in Household Comparison
Blacks/African Americans
Immigrants from Peru
17.3%
3 OR MORE VEHICLES IN HOUSEHOLD
0.3/ 100
METRIC RATING
283rd/ 347
METRIC RANK
19.4%
3 OR MORE VEHICLES IN HOUSEHOLD
41.1/ 100
METRIC RATING
177th/ 347
METRIC RANK
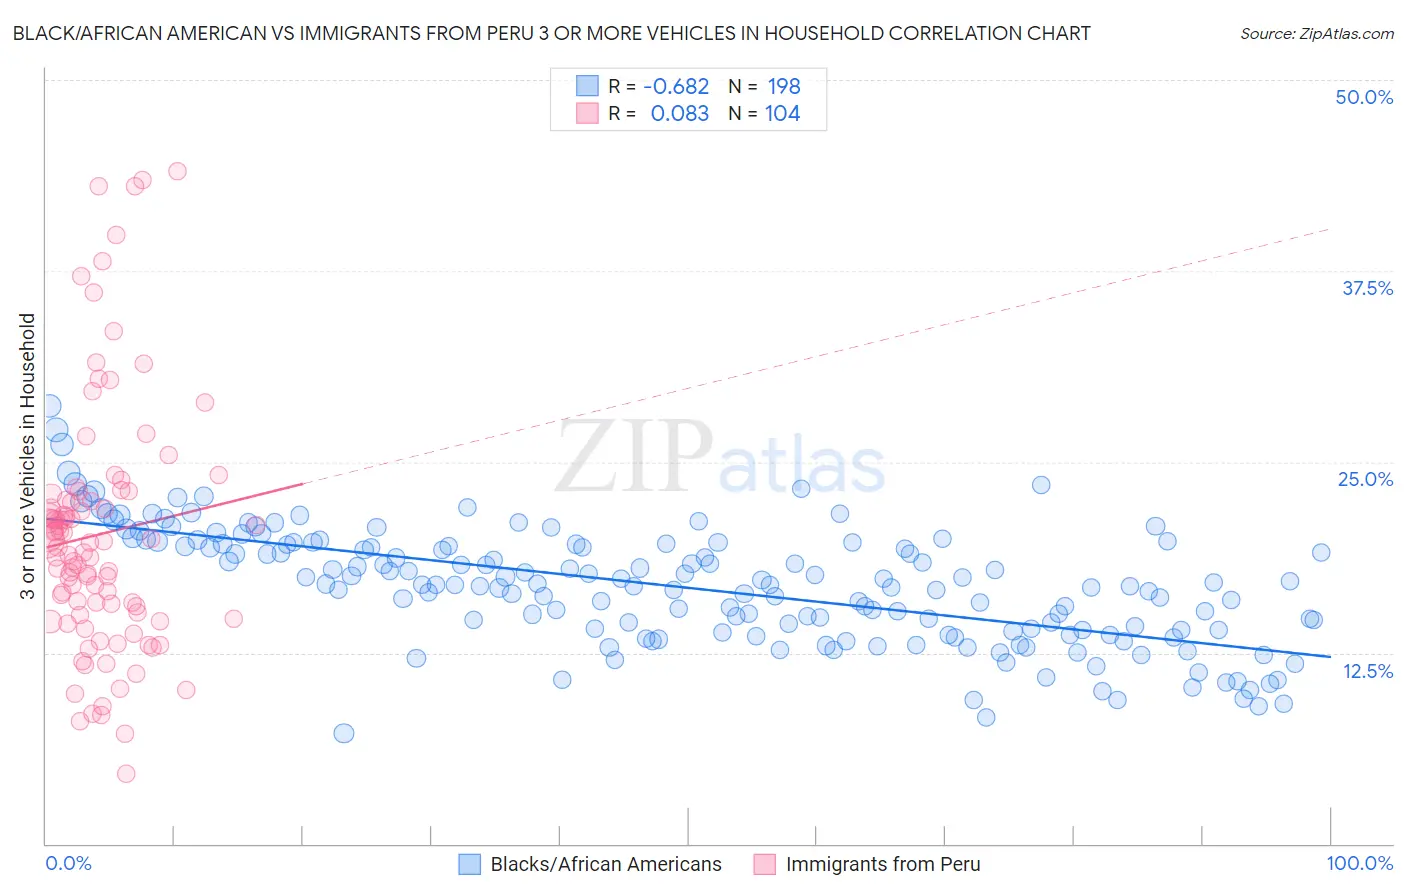
Black/African American vs Immigrants from Peru 3 or more Vehicles in Household Correlation Chart
The statistical analysis conducted on geographies consisting of 564,977,074 people shows a significant negative correlation between the proportion of Blacks/African Americans and percentage of households with 3 or more vehicles available in the United States with a correlation coefficient (R) of -0.682 and weighted average of 17.3%. Similarly, the statistical analysis conducted on geographies consisting of 328,696,716 people shows a slight positive correlation between the proportion of Immigrants from Peru and percentage of households with 3 or more vehicles available in the United States with a correlation coefficient (R) of 0.083 and weighted average of 19.4%, a difference of 11.7%.
3 or more Vehicles in Household Correlation Summary
| Measurement | Black/African American | Immigrants from Peru |
| Minimum | 7.2% | 4.5% |
| Maximum | 28.7% | 44.1% |
| Range | 21.4% | 39.5% |
| Mean | 16.8% | 20.3% |
| Median | 16.9% | 19.5% |
| Interquartile 25% (IQ1) | 14.0% | 15.0% |
| Interquartile 75% (IQ3) | 19.6% | 22.7% |
| Interquartile Range (IQR) | 5.6% | 7.7% |
| Standard Deviation (Sample) | 3.8% | 8.1% |
| Standard Deviation (Population) | 3.8% | 8.1% |
Similar Demographics by 3 or more Vehicles in Household
Demographics Similar to Blacks/African Americans by 3 or more Vehicles in Household
In terms of 3 or more vehicles in household, the demographic groups most similar to Blacks/African Americans are Immigrants from Ireland (17.3%, a difference of 0.050%), Immigrants from Colombia (17.3%, a difference of 0.12%), Immigrants from Latvia (17.4%, a difference of 0.34%), Immigrants from Eastern Europe (17.4%, a difference of 0.38%), and Immigrants from Kazakhstan (17.4%, a difference of 0.42%).
| Demographics | Rating | Rank | 3 or more Vehicles in Household |
| Okinawans | 0.4 /100 | #276 | Tragic 17.4% |
| Brazilians | 0.4 /100 | #277 | Tragic 17.4% |
| Immigrants | Bahamas | 0.3 /100 | #278 | Tragic 17.4% |
| Immigrants | Kazakhstan | 0.3 /100 | #279 | Tragic 17.4% |
| Immigrants | Eastern Europe | 0.3 /100 | #280 | Tragic 17.4% |
| Immigrants | Latvia | 0.3 /100 | #281 | Tragic 17.4% |
| Immigrants | Ireland | 0.3 /100 | #282 | Tragic 17.3% |
| Blacks/African Americans | 0.3 /100 | #283 | Tragic 17.3% |
| Immigrants | Colombia | 0.3 /100 | #284 | Tragic 17.3% |
| Immigrants | Croatia | 0.2 /100 | #285 | Tragic 17.2% |
| Menominee | 0.2 /100 | #286 | Tragic 17.2% |
| Immigrants | Brazil | 0.2 /100 | #287 | Tragic 17.1% |
| Immigrants | Uruguay | 0.2 /100 | #288 | Tragic 17.1% |
| Immigrants | Liberia | 0.1 /100 | #289 | Tragic 17.1% |
| Liberians | 0.1 /100 | #290 | Tragic 17.0% |
Demographics Similar to Immigrants from Peru by 3 or more Vehicles in Household
In terms of 3 or more vehicles in household, the demographic groups most similar to Immigrants from Peru are Immigrants from Syria (19.4%, a difference of 0.070%), Immigrants from South Central Asia (19.3%, a difference of 0.17%), South African (19.3%, a difference of 0.29%), Romanian (19.3%, a difference of 0.32%), and Cuban (19.3%, a difference of 0.36%).
| Demographics | Rating | Rank | 3 or more Vehicles in Household |
| Iraqis | 56.0 /100 | #170 | Average 19.6% |
| Immigrants | Western Europe | 53.2 /100 | #171 | Average 19.5% |
| Kiowa | 50.9 /100 | #172 | Average 19.5% |
| Immigrants | Northern Europe | 50.2 /100 | #173 | Average 19.5% |
| Immigrants | South Africa | 50.0 /100 | #174 | Average 19.5% |
| Syrians | 47.0 /100 | #175 | Average 19.5% |
| Iroquois | 46.0 /100 | #176 | Average 19.4% |
| Immigrants | Peru | 41.1 /100 | #177 | Average 19.4% |
| Immigrants | Syria | 40.3 /100 | #178 | Average 19.4% |
| Immigrants | South Central Asia | 38.9 /100 | #179 | Fair 19.3% |
| South Africans | 37.5 /100 | #180 | Fair 19.3% |
| Romanians | 37.1 /100 | #181 | Fair 19.3% |
| Cubans | 36.6 /100 | #182 | Fair 19.3% |
| Cajuns | 36.0 /100 | #183 | Fair 19.3% |
| Latvians | 35.7 /100 | #184 | Fair 19.3% |