Immigrants from Middle Africa vs Immigrants from Peru 3 or more Vehicles in Household
COMPARE
Immigrants from Middle Africa
Immigrants from Peru
3 or more Vehicles in Household
3 or more Vehicles in Household Comparison
Immigrants from Middle Africa
Immigrants from Peru
18.2%
3 OR MORE VEHICLES IN HOUSEHOLD
3.1/ 100
METRIC RATING
239th/ 347
METRIC RANK
19.4%
3 OR MORE VEHICLES IN HOUSEHOLD
41.1/ 100
METRIC RATING
177th/ 347
METRIC RANK
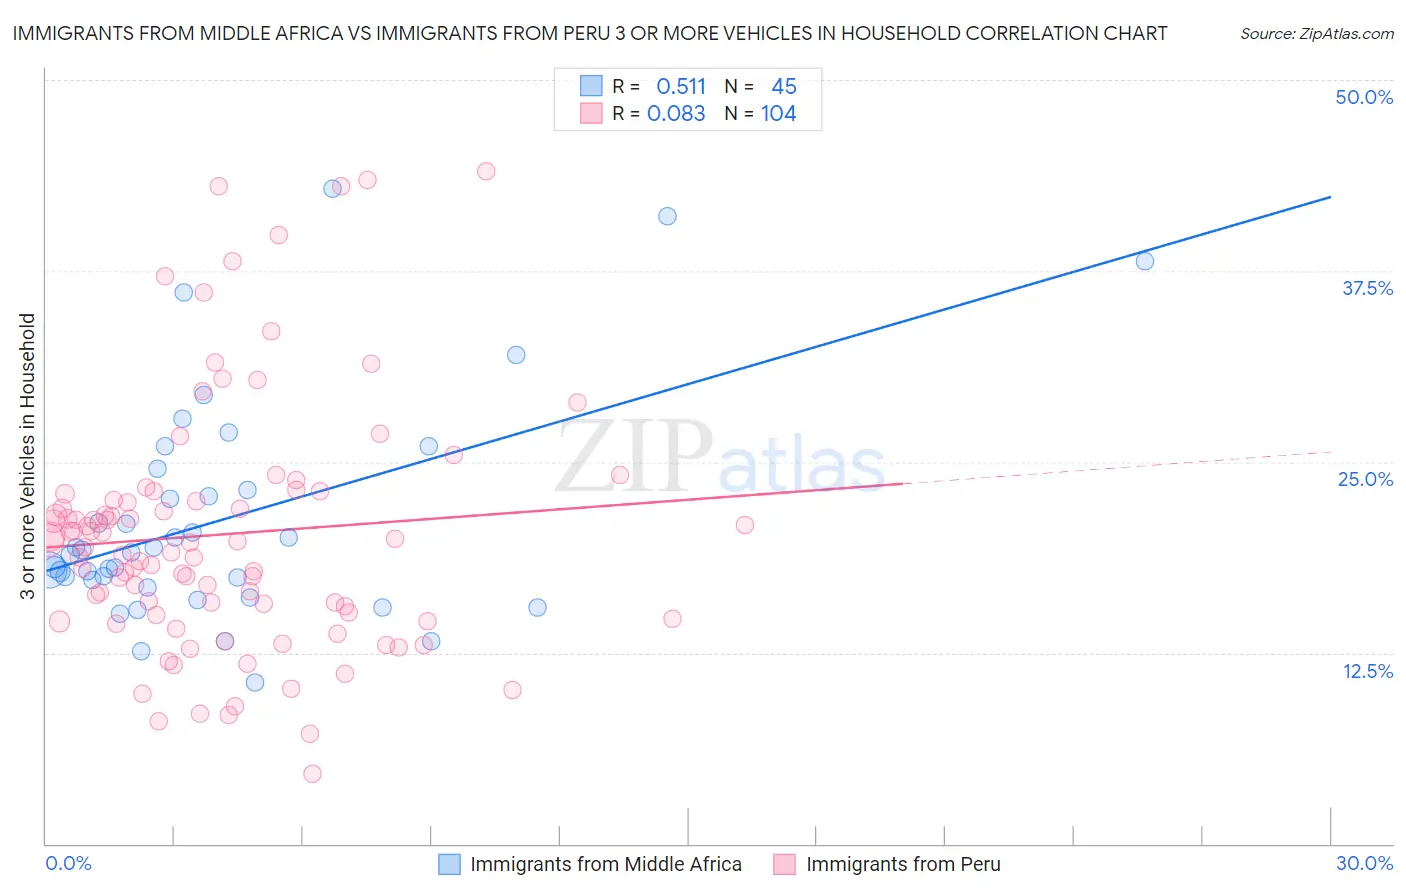
Immigrants from Middle Africa vs Immigrants from Peru 3 or more Vehicles in Household Correlation Chart
The statistical analysis conducted on geographies consisting of 202,639,411 people shows a substantial positive correlation between the proportion of Immigrants from Middle Africa and percentage of households with 3 or more vehicles available in the United States with a correlation coefficient (R) of 0.511 and weighted average of 18.2%. Similarly, the statistical analysis conducted on geographies consisting of 328,696,716 people shows a slight positive correlation between the proportion of Immigrants from Peru and percentage of households with 3 or more vehicles available in the United States with a correlation coefficient (R) of 0.083 and weighted average of 19.4%, a difference of 6.2%.
3 or more Vehicles in Household Correlation Summary
| Measurement | Immigrants from Middle Africa | Immigrants from Peru |
| Minimum | 10.6% | 4.5% |
| Maximum | 42.9% | 44.1% |
| Range | 32.3% | 39.5% |
| Mean | 21.2% | 20.3% |
| Median | 19.1% | 19.5% |
| Interquartile 25% (IQ1) | 17.0% | 15.0% |
| Interquartile 75% (IQ3) | 23.8% | 22.7% |
| Interquartile Range (IQR) | 6.8% | 7.7% |
| Standard Deviation (Sample) | 7.3% | 8.1% |
| Standard Deviation (Population) | 7.2% | 8.1% |
Similar Demographics by 3 or more Vehicles in Household
Demographics Similar to Immigrants from Middle Africa by 3 or more Vehicles in Household
In terms of 3 or more vehicles in household, the demographic groups most similar to Immigrants from Middle Africa are Immigrants from Honduras (18.2%, a difference of 0.010%), Immigrants from China (18.2%, a difference of 0.13%), Indonesian (18.3%, a difference of 0.24%), Immigrants from Malaysia (18.3%, a difference of 0.28%), and African (18.2%, a difference of 0.32%).
| Demographics | Rating | Rank | 3 or more Vehicles in Household |
| Immigrants | Uganda | 4.6 /100 | #232 | Tragic 18.4% |
| Hondurans | 4.6 /100 | #233 | Tragic 18.4% |
| Immigrants | North Macedonia | 4.4 /100 | #234 | Tragic 18.4% |
| Sierra Leoneans | 3.9 /100 | #235 | Tragic 18.3% |
| Immigrants | Malaysia | 3.6 /100 | #236 | Tragic 18.3% |
| Indonesians | 3.5 /100 | #237 | Tragic 18.3% |
| Immigrants | Honduras | 3.1 /100 | #238 | Tragic 18.2% |
| Immigrants | Middle Africa | 3.1 /100 | #239 | Tragic 18.2% |
| Immigrants | China | 2.9 /100 | #240 | Tragic 18.2% |
| Africans | 2.7 /100 | #241 | Tragic 18.2% |
| Hopi | 2.5 /100 | #242 | Tragic 18.2% |
| Immigrants | Europe | 2.4 /100 | #243 | Tragic 18.1% |
| Mongolians | 2.3 /100 | #244 | Tragic 18.1% |
| Immigrants | Belize | 2.1 /100 | #245 | Tragic 18.1% |
| Immigrants | Australia | 2.0 /100 | #246 | Tragic 18.1% |
Demographics Similar to Immigrants from Peru by 3 or more Vehicles in Household
In terms of 3 or more vehicles in household, the demographic groups most similar to Immigrants from Peru are Immigrants from Syria (19.4%, a difference of 0.070%), Immigrants from South Central Asia (19.3%, a difference of 0.17%), South African (19.3%, a difference of 0.29%), Romanian (19.3%, a difference of 0.32%), and Cuban (19.3%, a difference of 0.36%).
| Demographics | Rating | Rank | 3 or more Vehicles in Household |
| Iraqis | 56.0 /100 | #170 | Average 19.6% |
| Immigrants | Western Europe | 53.2 /100 | #171 | Average 19.5% |
| Kiowa | 50.9 /100 | #172 | Average 19.5% |
| Immigrants | Northern Europe | 50.2 /100 | #173 | Average 19.5% |
| Immigrants | South Africa | 50.0 /100 | #174 | Average 19.5% |
| Syrians | 47.0 /100 | #175 | Average 19.5% |
| Iroquois | 46.0 /100 | #176 | Average 19.4% |
| Immigrants | Peru | 41.1 /100 | #177 | Average 19.4% |
| Immigrants | Syria | 40.3 /100 | #178 | Average 19.4% |
| Immigrants | South Central Asia | 38.9 /100 | #179 | Fair 19.3% |
| South Africans | 37.5 /100 | #180 | Fair 19.3% |
| Romanians | 37.1 /100 | #181 | Fair 19.3% |
| Cubans | 36.6 /100 | #182 | Fair 19.3% |
| Cajuns | 36.0 /100 | #183 | Fair 19.3% |
| Latvians | 35.7 /100 | #184 | Fair 19.3% |