Immigrants from Hong Kong vs Thai 3 or more Vehicles in Household
COMPARE
Immigrants from Hong Kong
Thai
3 or more Vehicles in Household
3 or more Vehicles in Household Comparison
Immigrants from Hong Kong
Thais
19.2%
3 OR MORE VEHICLES IN HOUSEHOLD
28.3/ 100
METRIC RATING
187th/ 347
METRIC RANK
19.8%
3 OR MORE VEHICLES IN HOUSEHOLD
71.1/ 100
METRIC RATING
156th/ 347
METRIC RANK
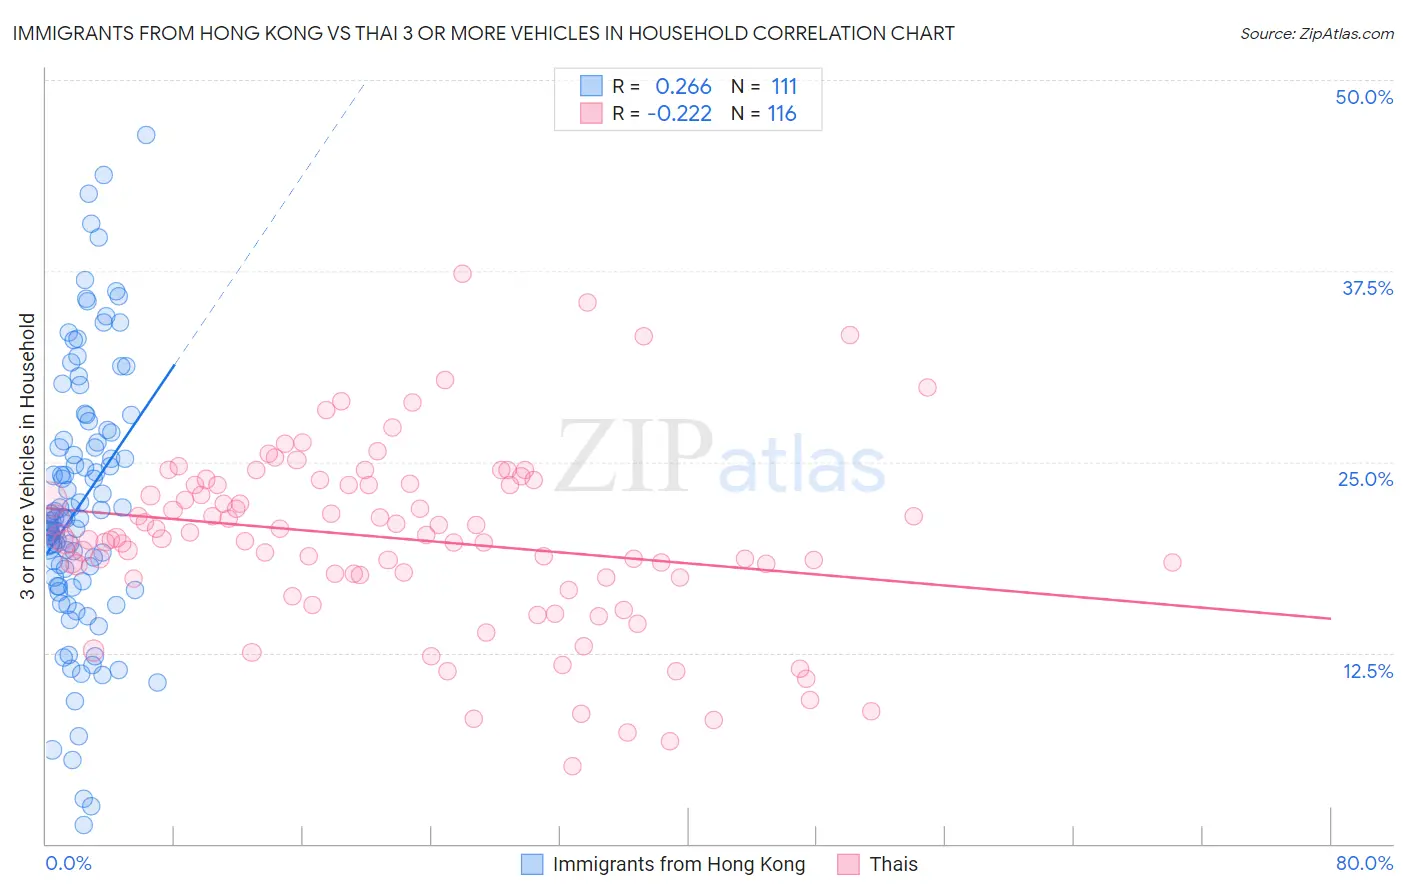
Immigrants from Hong Kong vs Thai 3 or more Vehicles in Household Correlation Chart
The statistical analysis conducted on geographies consisting of 253,800,113 people shows a weak positive correlation between the proportion of Immigrants from Hong Kong and percentage of households with 3 or more vehicles available in the United States with a correlation coefficient (R) of 0.266 and weighted average of 19.2%. Similarly, the statistical analysis conducted on geographies consisting of 475,154,298 people shows a weak negative correlation between the proportion of Thais and percentage of households with 3 or more vehicles available in the United States with a correlation coefficient (R) of -0.222 and weighted average of 19.8%, a difference of 3.5%.
3 or more Vehicles in Household Correlation Summary
| Measurement | Immigrants from Hong Kong | Thai |
| Minimum | 1.2% | 5.1% |
| Maximum | 46.4% | 37.3% |
| Range | 45.2% | 32.2% |
| Mean | 22.3% | 20.0% |
| Median | 21.3% | 20.0% |
| Interquartile 25% (IQ1) | 16.9% | 17.5% |
| Interquartile 75% (IQ3) | 27.1% | 23.5% |
| Interquartile Range (IQR) | 10.2% | 6.0% |
| Standard Deviation (Sample) | 8.8% | 5.9% |
| Standard Deviation (Population) | 8.8% | 5.9% |
Similar Demographics by 3 or more Vehicles in Household
Demographics Similar to Immigrants from Hong Kong by 3 or more Vehicles in Household
In terms of 3 or more vehicles in household, the demographic groups most similar to Immigrants from Hong Kong are Immigrants from Sweden (19.2%, a difference of 0.060%), Immigrants from Sri Lanka (19.2%, a difference of 0.22%), Immigrants from Kuwait (19.1%, a difference of 0.22%), Indian (Asian) (19.1%, a difference of 0.22%), and Immigrants from Zimbabwe (19.1%, a difference of 0.28%).
| Demographics | Rating | Rank | 3 or more Vehicles in Household |
| South Africans | 37.5 /100 | #180 | Fair 19.3% |
| Romanians | 37.1 /100 | #181 | Fair 19.3% |
| Cubans | 36.6 /100 | #182 | Fair 19.3% |
| Cajuns | 36.0 /100 | #183 | Fair 19.3% |
| Latvians | 35.7 /100 | #184 | Fair 19.3% |
| Immigrants | Sri Lanka | 30.7 /100 | #185 | Fair 19.2% |
| Immigrants | Sweden | 29.0 /100 | #186 | Fair 19.2% |
| Immigrants | Hong Kong | 28.3 /100 | #187 | Fair 19.2% |
| Immigrants | Kuwait | 26.1 /100 | #188 | Fair 19.1% |
| Indians (Asian) | 26.0 /100 | #189 | Fair 19.1% |
| Immigrants | Zimbabwe | 25.5 /100 | #190 | Fair 19.1% |
| South American Indians | 25.4 /100 | #191 | Fair 19.1% |
| Kenyans | 24.7 /100 | #192 | Fair 19.1% |
| Tsimshian | 24.4 /100 | #193 | Fair 19.1% |
| Serbians | 24.0 /100 | #194 | Fair 19.1% |
Demographics Similar to Thais by 3 or more Vehicles in Household
In terms of 3 or more vehicles in household, the demographic groups most similar to Thais are Hungarian (19.8%, a difference of 0.050%), Armenian (19.8%, a difference of 0.20%), Tlingit-Haida (19.9%, a difference of 0.21%), Immigrants from Pakistan (19.8%, a difference of 0.26%), and Immigrants from Lebanon (19.8%, a difference of 0.31%).
| Demographics | Rating | Rank | 3 or more Vehicles in Household |
| Immigrants | Iran | 80.9 /100 | #149 | Excellent 20.0% |
| Immigrants | Immigrants | 80.8 /100 | #150 | Excellent 20.0% |
| Taiwanese | 80.6 /100 | #151 | Excellent 20.0% |
| Lebanese | 79.8 /100 | #152 | Good 20.0% |
| Yuman | 75.6 /100 | #153 | Good 19.9% |
| Immigrants | Jordan | 75.0 /100 | #154 | Good 19.9% |
| Tlingit-Haida | 73.4 /100 | #155 | Good 19.9% |
| Thais | 71.1 /100 | #156 | Good 19.8% |
| Hungarians | 70.5 /100 | #157 | Good 19.8% |
| Armenians | 68.8 /100 | #158 | Good 19.8% |
| Immigrants | Pakistan | 68.2 /100 | #159 | Good 19.8% |
| Immigrants | Lebanon | 67.6 /100 | #160 | Good 19.8% |
| Immigrants | Guatemala | 65.6 /100 | #161 | Good 19.7% |
| Estonians | 63.2 /100 | #162 | Good 19.7% |
| Chileans | 63.0 /100 | #163 | Good 19.7% |