Immigrants from Latvia vs Thai 3 or more Vehicles in Household
COMPARE
Immigrants from Latvia
Thai
3 or more Vehicles in Household
3 or more Vehicles in Household Comparison
Immigrants from Latvia
Thais
17.4%
3 OR MORE VEHICLES IN HOUSEHOLD
0.3/ 100
METRIC RATING
281st/ 347
METRIC RANK
19.8%
3 OR MORE VEHICLES IN HOUSEHOLD
71.1/ 100
METRIC RATING
156th/ 347
METRIC RANK
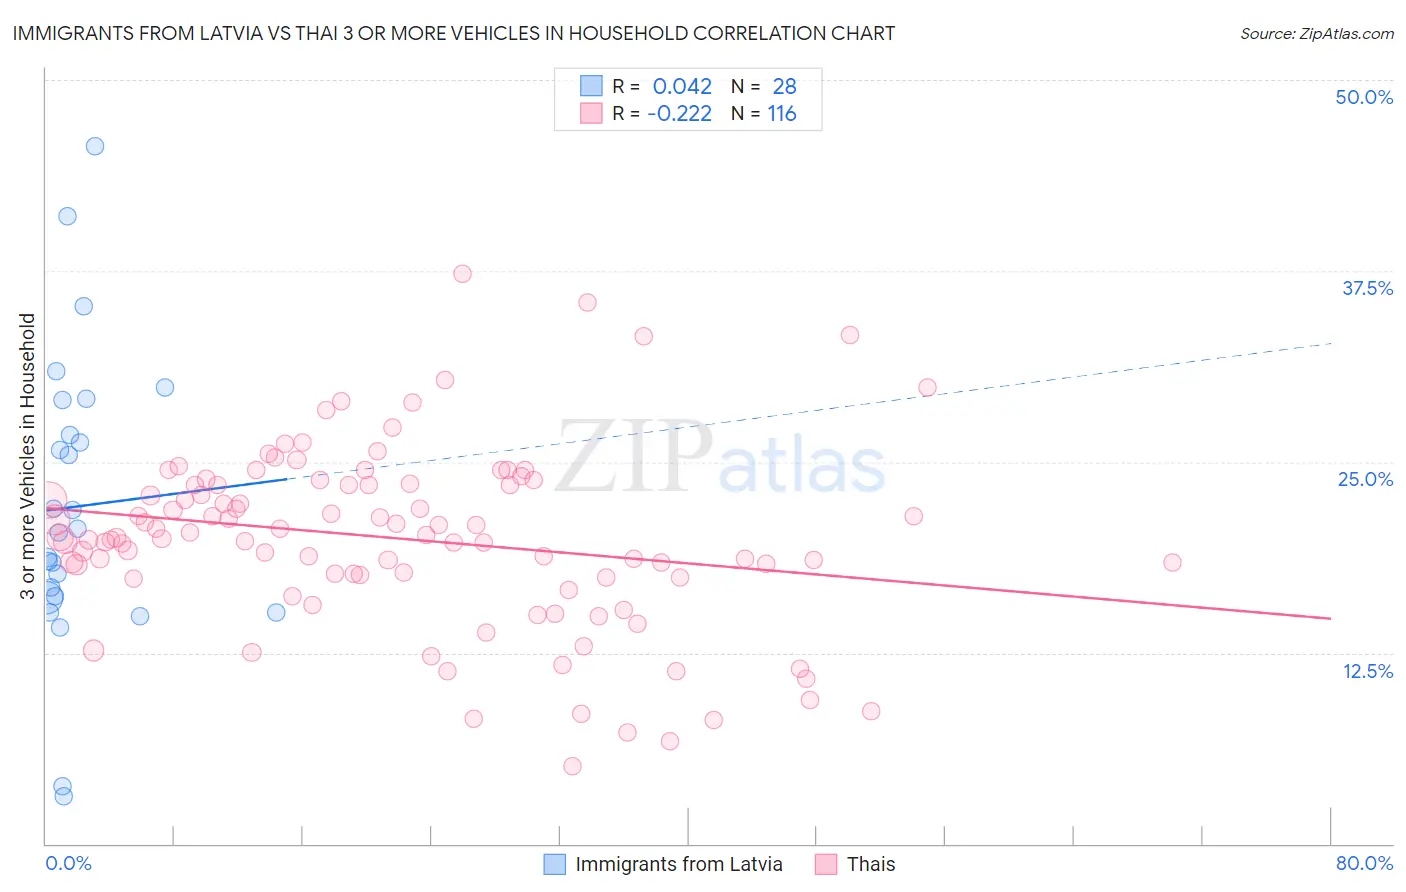
Immigrants from Latvia vs Thai 3 or more Vehicles in Household Correlation Chart
The statistical analysis conducted on geographies consisting of 113,711,739 people shows no correlation between the proportion of Immigrants from Latvia and percentage of households with 3 or more vehicles available in the United States with a correlation coefficient (R) of 0.042 and weighted average of 17.4%. Similarly, the statistical analysis conducted on geographies consisting of 475,154,298 people shows a weak negative correlation between the proportion of Thais and percentage of households with 3 or more vehicles available in the United States with a correlation coefficient (R) of -0.222 and weighted average of 19.8%, a difference of 14.1%.
3 or more Vehicles in Household Correlation Summary
| Measurement | Immigrants from Latvia | Thai |
| Minimum | 3.1% | 5.1% |
| Maximum | 45.7% | 37.3% |
| Range | 42.6% | 32.2% |
| Mean | 22.1% | 20.0% |
| Median | 20.5% | 20.0% |
| Interquartile 25% (IQ1) | 16.1% | 17.5% |
| Interquartile 75% (IQ3) | 27.9% | 23.5% |
| Interquartile Range (IQR) | 11.7% | 6.0% |
| Standard Deviation (Sample) | 9.5% | 5.9% |
| Standard Deviation (Population) | 9.4% | 5.9% |
Similar Demographics by 3 or more Vehicles in Household
Demographics Similar to Immigrants from Latvia by 3 or more Vehicles in Household
In terms of 3 or more vehicles in household, the demographic groups most similar to Immigrants from Latvia are Immigrants from Eastern Europe (17.4%, a difference of 0.040%), Immigrants from Kazakhstan (17.4%, a difference of 0.080%), Immigrants from Bahamas (17.4%, a difference of 0.10%), Brazilian (17.4%, a difference of 0.19%), and Immigrants from Ireland (17.3%, a difference of 0.29%).
| Demographics | Rating | Rank | 3 or more Vehicles in Household |
| Immigrants | Bosnia and Herzegovina | 0.5 /100 | #274 | Tragic 17.5% |
| Immigrants | Ukraine | 0.4 /100 | #275 | Tragic 17.5% |
| Okinawans | 0.4 /100 | #276 | Tragic 17.4% |
| Brazilians | 0.4 /100 | #277 | Tragic 17.4% |
| Immigrants | Bahamas | 0.3 /100 | #278 | Tragic 17.4% |
| Immigrants | Kazakhstan | 0.3 /100 | #279 | Tragic 17.4% |
| Immigrants | Eastern Europe | 0.3 /100 | #280 | Tragic 17.4% |
| Immigrants | Latvia | 0.3 /100 | #281 | Tragic 17.4% |
| Immigrants | Ireland | 0.3 /100 | #282 | Tragic 17.3% |
| Blacks/African Americans | 0.3 /100 | #283 | Tragic 17.3% |
| Immigrants | Colombia | 0.3 /100 | #284 | Tragic 17.3% |
| Immigrants | Croatia | 0.2 /100 | #285 | Tragic 17.2% |
| Menominee | 0.2 /100 | #286 | Tragic 17.2% |
| Immigrants | Brazil | 0.2 /100 | #287 | Tragic 17.1% |
| Immigrants | Uruguay | 0.2 /100 | #288 | Tragic 17.1% |
Demographics Similar to Thais by 3 or more Vehicles in Household
In terms of 3 or more vehicles in household, the demographic groups most similar to Thais are Hungarian (19.8%, a difference of 0.050%), Armenian (19.8%, a difference of 0.20%), Tlingit-Haida (19.9%, a difference of 0.21%), Immigrants from Pakistan (19.8%, a difference of 0.26%), and Immigrants from Lebanon (19.8%, a difference of 0.31%).
| Demographics | Rating | Rank | 3 or more Vehicles in Household |
| Immigrants | Iran | 80.9 /100 | #149 | Excellent 20.0% |
| Immigrants | Immigrants | 80.8 /100 | #150 | Excellent 20.0% |
| Taiwanese | 80.6 /100 | #151 | Excellent 20.0% |
| Lebanese | 79.8 /100 | #152 | Good 20.0% |
| Yuman | 75.6 /100 | #153 | Good 19.9% |
| Immigrants | Jordan | 75.0 /100 | #154 | Good 19.9% |
| Tlingit-Haida | 73.4 /100 | #155 | Good 19.9% |
| Thais | 71.1 /100 | #156 | Good 19.8% |
| Hungarians | 70.5 /100 | #157 | Good 19.8% |
| Armenians | 68.8 /100 | #158 | Good 19.8% |
| Immigrants | Pakistan | 68.2 /100 | #159 | Good 19.8% |
| Immigrants | Lebanon | 67.6 /100 | #160 | Good 19.8% |
| Immigrants | Guatemala | 65.6 /100 | #161 | Good 19.7% |
| Estonians | 63.2 /100 | #162 | Good 19.7% |
| Chileans | 63.0 /100 | #163 | Good 19.7% |