Immigrants from Hong Kong vs Immigrants from Dominica 3 or more Vehicles in Household
COMPARE
Immigrants from Hong Kong
Immigrants from Dominica
3 or more Vehicles in Household
3 or more Vehicles in Household Comparison
Immigrants from Hong Kong
Immigrants from Dominica
19.2%
3 OR MORE VEHICLES IN HOUSEHOLD
28.3/ 100
METRIC RATING
187th/ 347
METRIC RANK
13.7%
3 OR MORE VEHICLES IN HOUSEHOLD
0.0/ 100
METRIC RATING
331st/ 347
METRIC RANK
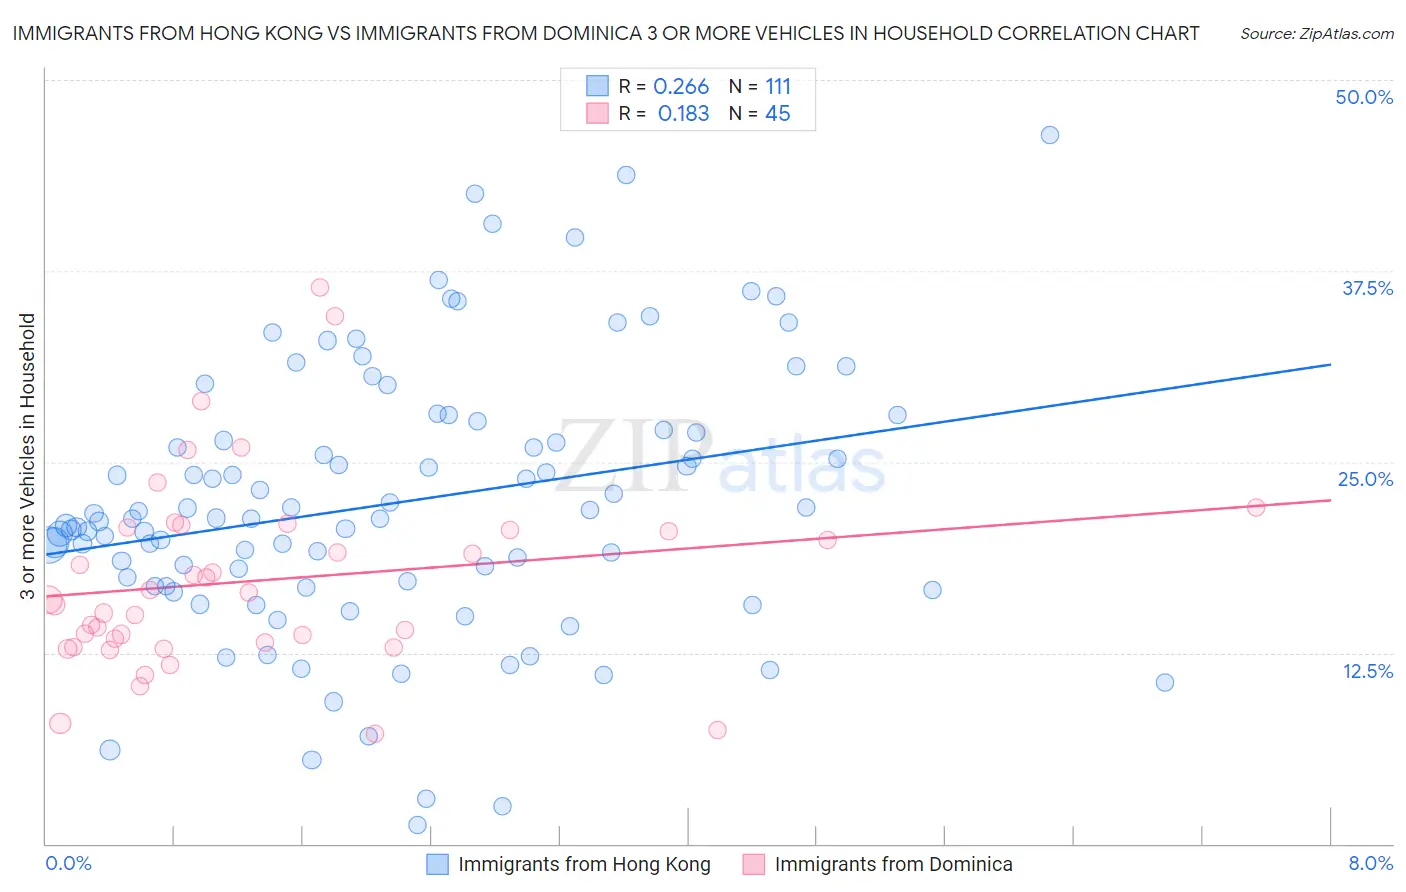
Immigrants from Hong Kong vs Immigrants from Dominica 3 or more Vehicles in Household Correlation Chart
The statistical analysis conducted on geographies consisting of 253,800,113 people shows a weak positive correlation between the proportion of Immigrants from Hong Kong and percentage of households with 3 or more vehicles available in the United States with a correlation coefficient (R) of 0.266 and weighted average of 19.2%. Similarly, the statistical analysis conducted on geographies consisting of 83,774,399 people shows a poor positive correlation between the proportion of Immigrants from Dominica and percentage of households with 3 or more vehicles available in the United States with a correlation coefficient (R) of 0.183 and weighted average of 13.7%, a difference of 39.7%.
3 or more Vehicles in Household Correlation Summary
| Measurement | Immigrants from Hong Kong | Immigrants from Dominica |
| Minimum | 1.2% | 7.2% |
| Maximum | 46.4% | 36.4% |
| Range | 45.2% | 29.3% |
| Mean | 22.3% | 17.2% |
| Median | 21.3% | 16.0% |
| Interquartile 25% (IQ1) | 16.9% | 13.0% |
| Interquartile 75% (IQ3) | 27.1% | 20.6% |
| Interquartile Range (IQR) | 10.2% | 7.6% |
| Standard Deviation (Sample) | 8.8% | 6.2% |
| Standard Deviation (Population) | 8.8% | 6.2% |
Similar Demographics by 3 or more Vehicles in Household
Demographics Similar to Immigrants from Hong Kong by 3 or more Vehicles in Household
In terms of 3 or more vehicles in household, the demographic groups most similar to Immigrants from Hong Kong are Immigrants from Sweden (19.2%, a difference of 0.060%), Immigrants from Sri Lanka (19.2%, a difference of 0.22%), Immigrants from Kuwait (19.1%, a difference of 0.22%), Indian (Asian) (19.1%, a difference of 0.22%), and Immigrants from Zimbabwe (19.1%, a difference of 0.28%).
| Demographics | Rating | Rank | 3 or more Vehicles in Household |
| South Africans | 37.5 /100 | #180 | Fair 19.3% |
| Romanians | 37.1 /100 | #181 | Fair 19.3% |
| Cubans | 36.6 /100 | #182 | Fair 19.3% |
| Cajuns | 36.0 /100 | #183 | Fair 19.3% |
| Latvians | 35.7 /100 | #184 | Fair 19.3% |
| Immigrants | Sri Lanka | 30.7 /100 | #185 | Fair 19.2% |
| Immigrants | Sweden | 29.0 /100 | #186 | Fair 19.2% |
| Immigrants | Hong Kong | 28.3 /100 | #187 | Fair 19.2% |
| Immigrants | Kuwait | 26.1 /100 | #188 | Fair 19.1% |
| Indians (Asian) | 26.0 /100 | #189 | Fair 19.1% |
| Immigrants | Zimbabwe | 25.5 /100 | #190 | Fair 19.1% |
| South American Indians | 25.4 /100 | #191 | Fair 19.1% |
| Kenyans | 24.7 /100 | #192 | Fair 19.1% |
| Tsimshian | 24.4 /100 | #193 | Fair 19.1% |
| Serbians | 24.0 /100 | #194 | Fair 19.1% |
Demographics Similar to Immigrants from Dominica by 3 or more Vehicles in Household
In terms of 3 or more vehicles in household, the demographic groups most similar to Immigrants from Dominica are West Indian (13.7%, a difference of 0.21%), Immigrants from Senegal (13.8%, a difference of 0.55%), Trinidadian and Tobagonian (13.6%, a difference of 0.71%), Immigrants from Cabo Verde (13.6%, a difference of 1.1%), and Immigrants from Albania (14.0%, a difference of 1.7%).
| Demographics | Rating | Rank | 3 or more Vehicles in Household |
| Immigrants | Yemen | 0.0 /100 | #324 | Tragic 14.2% |
| Senegalese | 0.0 /100 | #325 | Tragic 14.2% |
| Soviet Union | 0.0 /100 | #326 | Tragic 14.2% |
| Ecuadorians | 0.0 /100 | #327 | Tragic 14.1% |
| Immigrants | Albania | 0.0 /100 | #328 | Tragic 14.0% |
| Immigrants | Senegal | 0.0 /100 | #329 | Tragic 13.8% |
| West Indians | 0.0 /100 | #330 | Tragic 13.7% |
| Immigrants | Dominica | 0.0 /100 | #331 | Tragic 13.7% |
| Trinidadians and Tobagonians | 0.0 /100 | #332 | Tragic 13.6% |
| Immigrants | Cabo Verde | 0.0 /100 | #333 | Tragic 13.6% |
| Immigrants | Ecuador | 0.0 /100 | #334 | Tragic 13.4% |
| Immigrants | Trinidad and Tobago | 0.0 /100 | #335 | Tragic 13.3% |
| Barbadians | 0.0 /100 | #336 | Tragic 12.6% |
| Immigrants | Bangladesh | 0.0 /100 | #337 | Tragic 12.5% |
| Vietnamese | 0.0 /100 | #338 | Tragic 12.5% |