Immigrants from Hong Kong vs Immigrants from Uruguay 3 or more Vehicles in Household
COMPARE
Immigrants from Hong Kong
Immigrants from Uruguay
3 or more Vehicles in Household
3 or more Vehicles in Household Comparison
Immigrants from Hong Kong
Immigrants from Uruguay
19.2%
3 OR MORE VEHICLES IN HOUSEHOLD
28.3/ 100
METRIC RATING
187th/ 347
METRIC RANK
17.1%
3 OR MORE VEHICLES IN HOUSEHOLD
0.2/ 100
METRIC RATING
288th/ 347
METRIC RANK
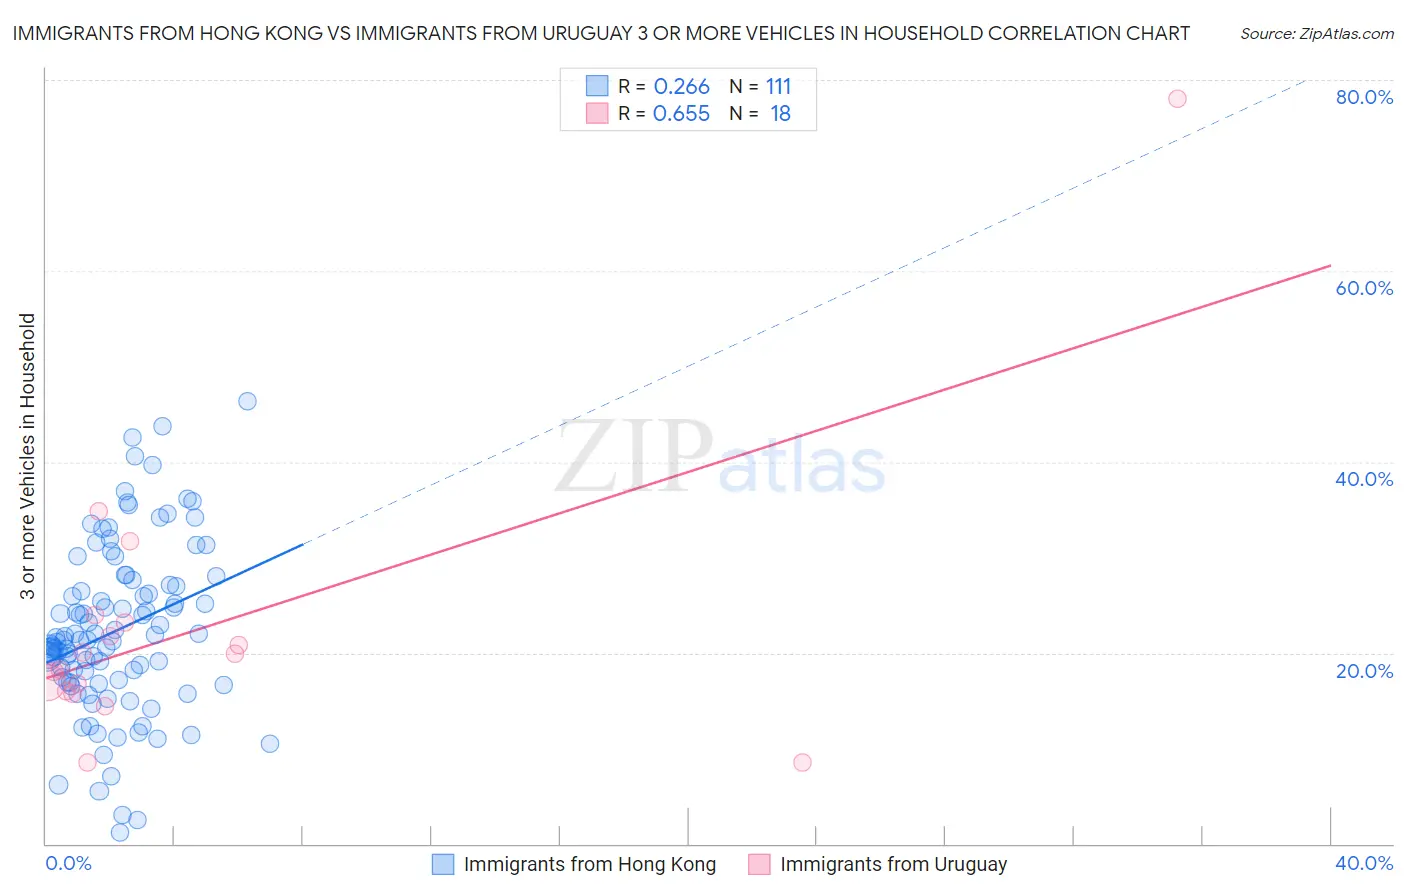
Immigrants from Hong Kong vs Immigrants from Uruguay 3 or more Vehicles in Household Correlation Chart
The statistical analysis conducted on geographies consisting of 253,800,113 people shows a weak positive correlation between the proportion of Immigrants from Hong Kong and percentage of households with 3 or more vehicles available in the United States with a correlation coefficient (R) of 0.266 and weighted average of 19.2%. Similarly, the statistical analysis conducted on geographies consisting of 133,238,313 people shows a significant positive correlation between the proportion of Immigrants from Uruguay and percentage of households with 3 or more vehicles available in the United States with a correlation coefficient (R) of 0.655 and weighted average of 17.1%, a difference of 12.0%.
3 or more Vehicles in Household Correlation Summary
| Measurement | Immigrants from Hong Kong | Immigrants from Uruguay |
| Minimum | 1.2% | 8.6% |
| Maximum | 46.4% | 78.0% |
| Range | 45.2% | 69.5% |
| Mean | 22.3% | 22.6% |
| Median | 21.3% | 19.0% |
| Interquartile 25% (IQ1) | 16.9% | 16.0% |
| Interquartile 75% (IQ3) | 27.1% | 23.1% |
| Interquartile Range (IQR) | 10.2% | 7.1% |
| Standard Deviation (Sample) | 8.8% | 15.3% |
| Standard Deviation (Population) | 8.8% | 14.9% |
Similar Demographics by 3 or more Vehicles in Household
Demographics Similar to Immigrants from Hong Kong by 3 or more Vehicles in Household
In terms of 3 or more vehicles in household, the demographic groups most similar to Immigrants from Hong Kong are Immigrants from Sweden (19.2%, a difference of 0.060%), Immigrants from Sri Lanka (19.2%, a difference of 0.22%), Immigrants from Kuwait (19.1%, a difference of 0.22%), Indian (Asian) (19.1%, a difference of 0.22%), and Immigrants from Zimbabwe (19.1%, a difference of 0.28%).
| Demographics | Rating | Rank | 3 or more Vehicles in Household |
| South Africans | 37.5 /100 | #180 | Fair 19.3% |
| Romanians | 37.1 /100 | #181 | Fair 19.3% |
| Cubans | 36.6 /100 | #182 | Fair 19.3% |
| Cajuns | 36.0 /100 | #183 | Fair 19.3% |
| Latvians | 35.7 /100 | #184 | Fair 19.3% |
| Immigrants | Sri Lanka | 30.7 /100 | #185 | Fair 19.2% |
| Immigrants | Sweden | 29.0 /100 | #186 | Fair 19.2% |
| Immigrants | Hong Kong | 28.3 /100 | #187 | Fair 19.2% |
| Immigrants | Kuwait | 26.1 /100 | #188 | Fair 19.1% |
| Indians (Asian) | 26.0 /100 | #189 | Fair 19.1% |
| Immigrants | Zimbabwe | 25.5 /100 | #190 | Fair 19.1% |
| South American Indians | 25.4 /100 | #191 | Fair 19.1% |
| Kenyans | 24.7 /100 | #192 | Fair 19.1% |
| Tsimshian | 24.4 /100 | #193 | Fair 19.1% |
| Serbians | 24.0 /100 | #194 | Fair 19.1% |
Demographics Similar to Immigrants from Uruguay by 3 or more Vehicles in Household
In terms of 3 or more vehicles in household, the demographic groups most similar to Immigrants from Uruguay are Immigrants from Liberia (17.1%, a difference of 0.070%), Immigrants from Brazil (17.1%, a difference of 0.090%), Menominee (17.2%, a difference of 0.39%), Immigrants from Croatia (17.2%, a difference of 0.45%), and Liberian (17.0%, a difference of 0.64%).
| Demographics | Rating | Rank | 3 or more Vehicles in Household |
| Immigrants | Latvia | 0.3 /100 | #281 | Tragic 17.4% |
| Immigrants | Ireland | 0.3 /100 | #282 | Tragic 17.3% |
| Blacks/African Americans | 0.3 /100 | #283 | Tragic 17.3% |
| Immigrants | Colombia | 0.3 /100 | #284 | Tragic 17.3% |
| Immigrants | Croatia | 0.2 /100 | #285 | Tragic 17.2% |
| Menominee | 0.2 /100 | #286 | Tragic 17.2% |
| Immigrants | Brazil | 0.2 /100 | #287 | Tragic 17.1% |
| Immigrants | Uruguay | 0.2 /100 | #288 | Tragic 17.1% |
| Immigrants | Liberia | 0.1 /100 | #289 | Tragic 17.1% |
| Liberians | 0.1 /100 | #290 | Tragic 17.0% |
| Immigrants | Congo | 0.1 /100 | #291 | Tragic 17.0% |
| Immigrants | Spain | 0.1 /100 | #292 | Tragic 17.0% |
| Bahamians | 0.1 /100 | #293 | Tragic 16.9% |
| Immigrants | Western Africa | 0.1 /100 | #294 | Tragic 16.9% |
| Immigrants | Russia | 0.1 /100 | #295 | Tragic 16.9% |