Subsaharan African vs Thai 3 or more Vehicles in Household
COMPARE
Subsaharan African
Thai
3 or more Vehicles in Household
3 or more Vehicles in Household Comparison
Sub-Saharan Africans
Thais
17.9%
3 OR MORE VEHICLES IN HOUSEHOLD
1.1/ 100
METRIC RATING
256th/ 347
METRIC RANK
19.8%
3 OR MORE VEHICLES IN HOUSEHOLD
71.1/ 100
METRIC RATING
156th/ 347
METRIC RANK
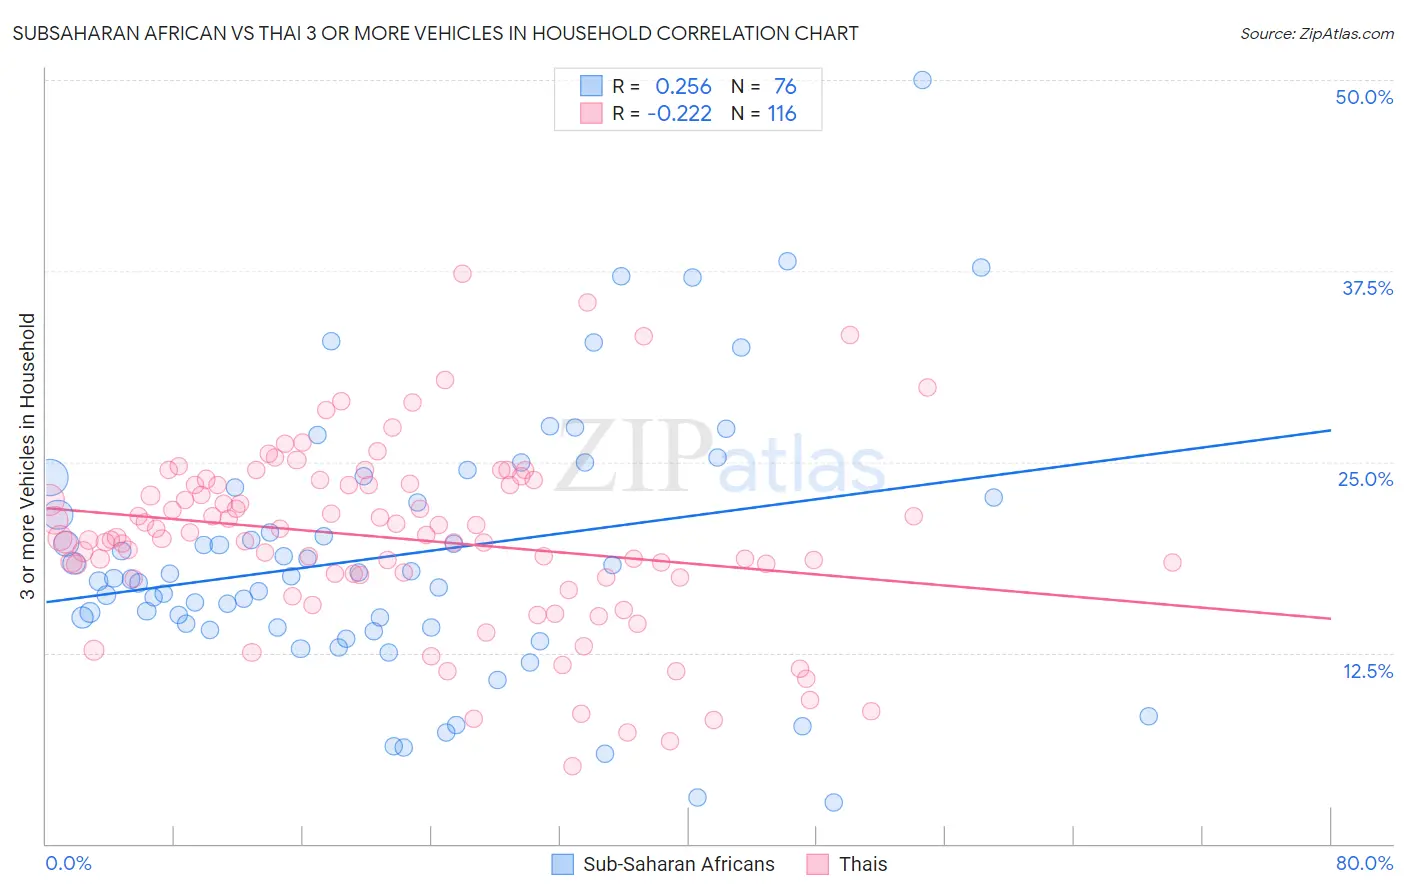
Subsaharan African vs Thai 3 or more Vehicles in Household Correlation Chart
The statistical analysis conducted on geographies consisting of 507,393,924 people shows a weak positive correlation between the proportion of Sub-Saharan Africans and percentage of households with 3 or more vehicles available in the United States with a correlation coefficient (R) of 0.256 and weighted average of 17.9%. Similarly, the statistical analysis conducted on geographies consisting of 475,154,298 people shows a weak negative correlation between the proportion of Thais and percentage of households with 3 or more vehicles available in the United States with a correlation coefficient (R) of -0.222 and weighted average of 19.8%, a difference of 11.1%.
3 or more Vehicles in Household Correlation Summary
| Measurement | Subsaharan African | Thai |
| Minimum | 2.7% | 5.1% |
| Maximum | 50.0% | 37.3% |
| Range | 47.3% | 32.2% |
| Mean | 18.9% | 20.0% |
| Median | 17.4% | 20.0% |
| Interquartile 25% (IQ1) | 14.2% | 17.5% |
| Interquartile 75% (IQ3) | 23.0% | 23.5% |
| Interquartile Range (IQR) | 8.9% | 6.0% |
| Standard Deviation (Sample) | 8.6% | 5.9% |
| Standard Deviation (Population) | 8.5% | 5.9% |
Similar Demographics by 3 or more Vehicles in Household
Demographics Similar to Sub-Saharan Africans by 3 or more Vehicles in Household
In terms of 3 or more vehicles in household, the demographic groups most similar to Sub-Saharan Africans are Immigrants from Eritrea (17.8%, a difference of 0.050%), Sudanese (17.8%, a difference of 0.050%), Immigrants from Turkey (17.9%, a difference of 0.15%), Ethiopian (17.9%, a difference of 0.18%), and Immigrants from Ethiopia (17.9%, a difference of 0.19%).
| Demographics | Rating | Rank | 3 or more Vehicles in Household |
| Immigrants | Saudi Arabia | 1.7 /100 | #249 | Tragic 18.0% |
| Venezuelans | 1.7 /100 | #250 | Tragic 18.0% |
| Alsatians | 1.5 /100 | #251 | Tragic 18.0% |
| Immigrants | Southern Europe | 1.4 /100 | #252 | Tragic 17.9% |
| Immigrants | Ethiopia | 1.3 /100 | #253 | Tragic 17.9% |
| Ethiopians | 1.2 /100 | #254 | Tragic 17.9% |
| Immigrants | Turkey | 1.2 /100 | #255 | Tragic 17.9% |
| Sub-Saharan Africans | 1.1 /100 | #256 | Tragic 17.9% |
| Immigrants | Eritrea | 1.1 /100 | #257 | Tragic 17.8% |
| Sudanese | 1.1 /100 | #258 | Tragic 17.8% |
| Uruguayans | 1.0 /100 | #259 | Tragic 17.8% |
| Ugandans | 0.9 /100 | #260 | Tragic 17.8% |
| Immigrants | Northern Africa | 0.9 /100 | #261 | Tragic 17.8% |
| Colombians | 0.9 /100 | #262 | Tragic 17.8% |
| Bermudans | 0.9 /100 | #263 | Tragic 17.8% |
Demographics Similar to Thais by 3 or more Vehicles in Household
In terms of 3 or more vehicles in household, the demographic groups most similar to Thais are Hungarian (19.8%, a difference of 0.050%), Armenian (19.8%, a difference of 0.20%), Tlingit-Haida (19.9%, a difference of 0.21%), Immigrants from Pakistan (19.8%, a difference of 0.26%), and Immigrants from Lebanon (19.8%, a difference of 0.31%).
| Demographics | Rating | Rank | 3 or more Vehicles in Household |
| Immigrants | Iran | 80.9 /100 | #149 | Excellent 20.0% |
| Immigrants | Immigrants | 80.8 /100 | #150 | Excellent 20.0% |
| Taiwanese | 80.6 /100 | #151 | Excellent 20.0% |
| Lebanese | 79.8 /100 | #152 | Good 20.0% |
| Yuman | 75.6 /100 | #153 | Good 19.9% |
| Immigrants | Jordan | 75.0 /100 | #154 | Good 19.9% |
| Tlingit-Haida | 73.4 /100 | #155 | Good 19.9% |
| Thais | 71.1 /100 | #156 | Good 19.8% |
| Hungarians | 70.5 /100 | #157 | Good 19.8% |
| Armenians | 68.8 /100 | #158 | Good 19.8% |
| Immigrants | Pakistan | 68.2 /100 | #159 | Good 19.8% |
| Immigrants | Lebanon | 67.6 /100 | #160 | Good 19.8% |
| Immigrants | Guatemala | 65.6 /100 | #161 | Good 19.7% |
| Estonians | 63.2 /100 | #162 | Good 19.7% |
| Chileans | 63.0 /100 | #163 | Good 19.7% |