Immigrants from Cuba vs Thai 3 or more Vehicles in Household
COMPARE
Immigrants from Cuba
Thai
3 or more Vehicles in Household
3 or more Vehicles in Household Comparison
Immigrants from Cuba
Thais
18.8%
3 OR MORE VEHICLES IN HOUSEHOLD
11.6/ 100
METRIC RATING
213th/ 347
METRIC RANK
19.8%
3 OR MORE VEHICLES IN HOUSEHOLD
71.1/ 100
METRIC RATING
156th/ 347
METRIC RANK
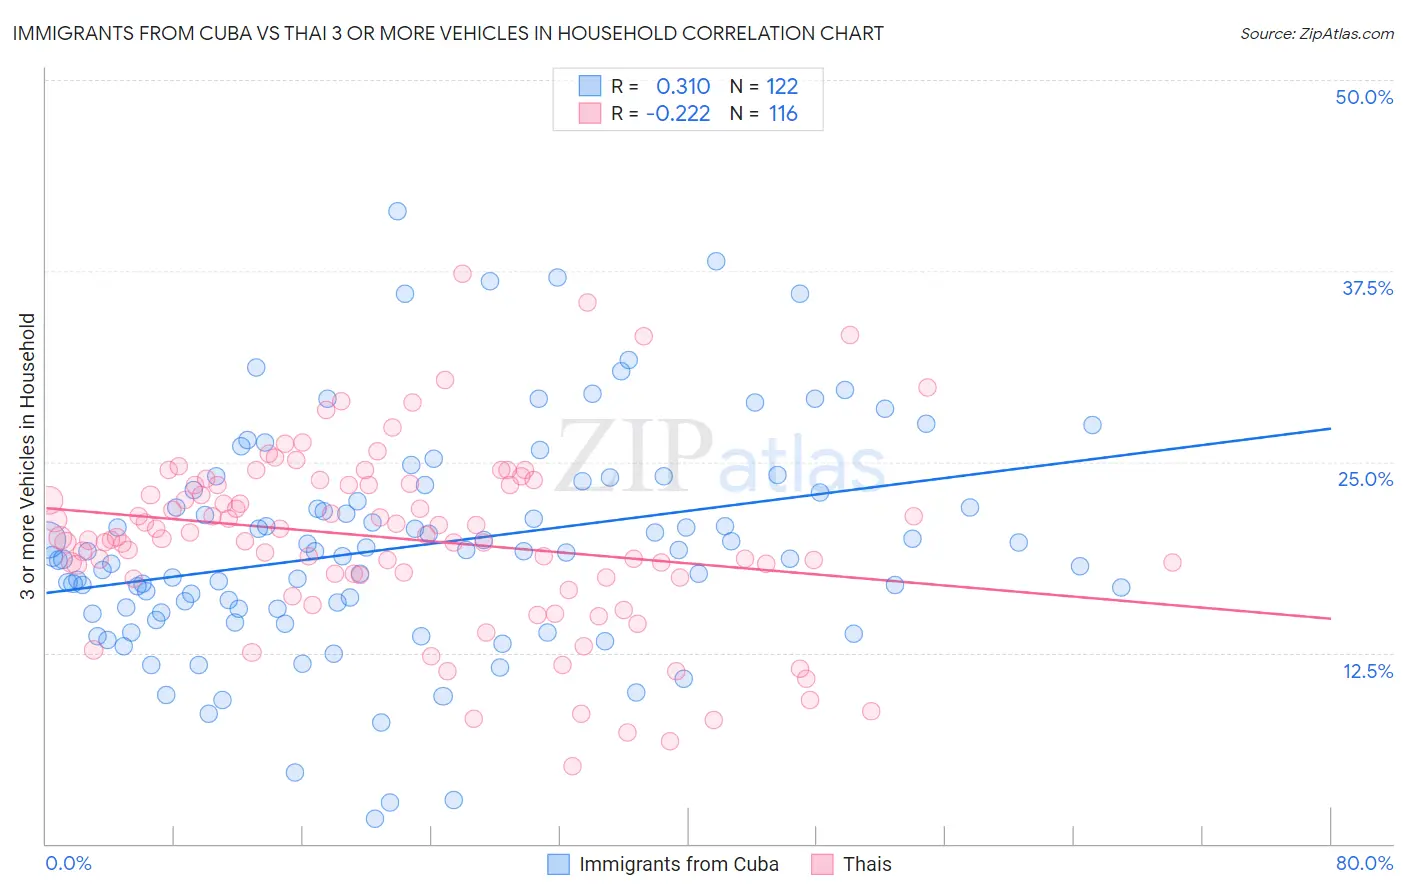
Immigrants from Cuba vs Thai 3 or more Vehicles in Household Correlation Chart
The statistical analysis conducted on geographies consisting of 325,895,387 people shows a mild positive correlation between the proportion of Immigrants from Cuba and percentage of households with 3 or more vehicles available in the United States with a correlation coefficient (R) of 0.310 and weighted average of 18.8%. Similarly, the statistical analysis conducted on geographies consisting of 475,154,298 people shows a weak negative correlation between the proportion of Thais and percentage of households with 3 or more vehicles available in the United States with a correlation coefficient (R) of -0.222 and weighted average of 19.8%, a difference of 5.8%.
3 or more Vehicles in Household Correlation Summary
| Measurement | Immigrants from Cuba | Thai |
| Minimum | 1.6% | 5.1% |
| Maximum | 41.4% | 37.3% |
| Range | 39.8% | 32.2% |
| Mean | 19.5% | 20.0% |
| Median | 19.1% | 20.0% |
| Interquartile 25% (IQ1) | 15.3% | 17.5% |
| Interquartile 75% (IQ3) | 23.1% | 23.5% |
| Interquartile Range (IQR) | 7.8% | 6.0% |
| Standard Deviation (Sample) | 7.3% | 5.9% |
| Standard Deviation (Population) | 7.2% | 5.9% |
Similar Demographics by 3 or more Vehicles in Household
Demographics Similar to Immigrants from Cuba by 3 or more Vehicles in Household
In terms of 3 or more vehicles in household, the demographic groups most similar to Immigrants from Cuba are Panamanian (18.8%, a difference of 0.010%), Immigrants from Kenya (18.8%, a difference of 0.15%), Immigrants from Sierra Leone (18.7%, a difference of 0.15%), Eastern European (18.7%, a difference of 0.20%), and Immigrants from Nigeria (18.7%, a difference of 0.26%).
| Demographics | Rating | Rank | 3 or more Vehicles in Household |
| Immigrants | Eastern Asia | 14.1 /100 | #206 | Poor 18.8% |
| Immigrants | Chile | 13.6 /100 | #207 | Poor 18.8% |
| Immigrants | Burma/Myanmar | 13.6 /100 | #208 | Poor 18.8% |
| Immigrants | Egypt | 13.5 /100 | #209 | Poor 18.8% |
| Bulgarians | 13.1 /100 | #210 | Poor 18.8% |
| Immigrants | Kenya | 12.4 /100 | #211 | Poor 18.8% |
| Panamanians | 11.6 /100 | #212 | Poor 18.8% |
| Immigrants | Cuba | 11.6 /100 | #213 | Poor 18.8% |
| Immigrants | Sierra Leone | 10.8 /100 | #214 | Poor 18.7% |
| Eastern Europeans | 10.6 /100 | #215 | Poor 18.7% |
| Immigrants | Nigeria | 10.3 /100 | #216 | Poor 18.7% |
| Immigrants | Italy | 10.2 /100 | #217 | Poor 18.7% |
| Immigrants | Portugal | 8.9 /100 | #218 | Tragic 18.6% |
| Immigrants | Armenia | 8.6 /100 | #219 | Tragic 18.6% |
| Nigerians | 7.9 /100 | #220 | Tragic 18.6% |
Demographics Similar to Thais by 3 or more Vehicles in Household
In terms of 3 or more vehicles in household, the demographic groups most similar to Thais are Hungarian (19.8%, a difference of 0.050%), Armenian (19.8%, a difference of 0.20%), Tlingit-Haida (19.9%, a difference of 0.21%), Immigrants from Pakistan (19.8%, a difference of 0.26%), and Immigrants from Lebanon (19.8%, a difference of 0.31%).
| Demographics | Rating | Rank | 3 or more Vehicles in Household |
| Immigrants | Iran | 80.9 /100 | #149 | Excellent 20.0% |
| Immigrants | Immigrants | 80.8 /100 | #150 | Excellent 20.0% |
| Taiwanese | 80.6 /100 | #151 | Excellent 20.0% |
| Lebanese | 79.8 /100 | #152 | Good 20.0% |
| Yuman | 75.6 /100 | #153 | Good 19.9% |
| Immigrants | Jordan | 75.0 /100 | #154 | Good 19.9% |
| Tlingit-Haida | 73.4 /100 | #155 | Good 19.9% |
| Thais | 71.1 /100 | #156 | Good 19.8% |
| Hungarians | 70.5 /100 | #157 | Good 19.8% |
| Armenians | 68.8 /100 | #158 | Good 19.8% |
| Immigrants | Pakistan | 68.2 /100 | #159 | Good 19.8% |
| Immigrants | Lebanon | 67.6 /100 | #160 | Good 19.8% |
| Immigrants | Guatemala | 65.6 /100 | #161 | Good 19.7% |
| Estonians | 63.2 /100 | #162 | Good 19.7% |
| Chileans | 63.0 /100 | #163 | Good 19.7% |