Immigrants from Hong Kong vs Bhutanese 3 or more Vehicles in Household
COMPARE
Immigrants from Hong Kong
Bhutanese
3 or more Vehicles in Household
3 or more Vehicles in Household Comparison
Immigrants from Hong Kong
Bhutanese
19.2%
3 OR MORE VEHICLES IN HOUSEHOLD
28.3/ 100
METRIC RATING
187th/ 347
METRIC RANK
22.2%
3 OR MORE VEHICLES IN HOUSEHOLD
99.9/ 100
METRIC RATING
61st/ 347
METRIC RANK
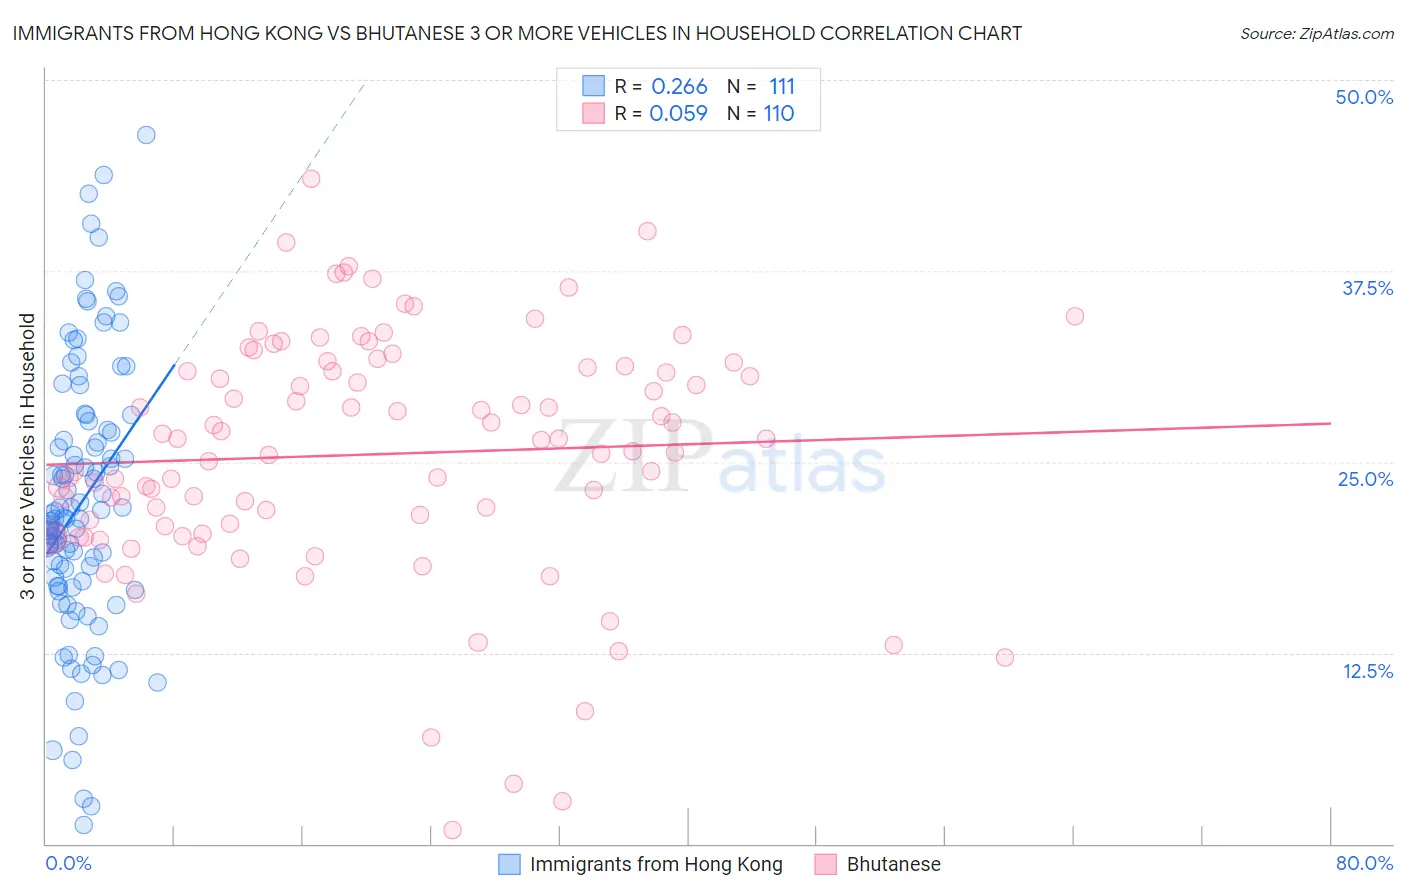
Immigrants from Hong Kong vs Bhutanese 3 or more Vehicles in Household Correlation Chart
The statistical analysis conducted on geographies consisting of 253,800,113 people shows a weak positive correlation between the proportion of Immigrants from Hong Kong and percentage of households with 3 or more vehicles available in the United States with a correlation coefficient (R) of 0.266 and weighted average of 19.2%. Similarly, the statistical analysis conducted on geographies consisting of 454,966,452 people shows a slight positive correlation between the proportion of Bhutanese and percentage of households with 3 or more vehicles available in the United States with a correlation coefficient (R) of 0.059 and weighted average of 22.2%, a difference of 16.1%.
3 or more Vehicles in Household Correlation Summary
| Measurement | Immigrants from Hong Kong | Bhutanese |
| Minimum | 1.2% | 0.93% |
| Maximum | 46.4% | 43.5% |
| Range | 45.2% | 42.6% |
| Mean | 22.3% | 25.5% |
| Median | 21.3% | 26.1% |
| Interquartile 25% (IQ1) | 16.9% | 20.7% |
| Interquartile 75% (IQ3) | 27.1% | 31.2% |
| Interquartile Range (IQR) | 10.2% | 10.4% |
| Standard Deviation (Sample) | 8.8% | 7.9% |
| Standard Deviation (Population) | 8.8% | 7.9% |
Similar Demographics by 3 or more Vehicles in Household
Demographics Similar to Immigrants from Hong Kong by 3 or more Vehicles in Household
In terms of 3 or more vehicles in household, the demographic groups most similar to Immigrants from Hong Kong are Immigrants from Sweden (19.2%, a difference of 0.060%), Immigrants from Sri Lanka (19.2%, a difference of 0.22%), Immigrants from Kuwait (19.1%, a difference of 0.22%), Indian (Asian) (19.1%, a difference of 0.22%), and Immigrants from Zimbabwe (19.1%, a difference of 0.28%).
| Demographics | Rating | Rank | 3 or more Vehicles in Household |
| South Africans | 37.5 /100 | #180 | Fair 19.3% |
| Romanians | 37.1 /100 | #181 | Fair 19.3% |
| Cubans | 36.6 /100 | #182 | Fair 19.3% |
| Cajuns | 36.0 /100 | #183 | Fair 19.3% |
| Latvians | 35.7 /100 | #184 | Fair 19.3% |
| Immigrants | Sri Lanka | 30.7 /100 | #185 | Fair 19.2% |
| Immigrants | Sweden | 29.0 /100 | #186 | Fair 19.2% |
| Immigrants | Hong Kong | 28.3 /100 | #187 | Fair 19.2% |
| Immigrants | Kuwait | 26.1 /100 | #188 | Fair 19.1% |
| Indians (Asian) | 26.0 /100 | #189 | Fair 19.1% |
| Immigrants | Zimbabwe | 25.5 /100 | #190 | Fair 19.1% |
| South American Indians | 25.4 /100 | #191 | Fair 19.1% |
| Kenyans | 24.7 /100 | #192 | Fair 19.1% |
| Tsimshian | 24.4 /100 | #193 | Fair 19.1% |
| Serbians | 24.0 /100 | #194 | Fair 19.1% |
Demographics Similar to Bhutanese by 3 or more Vehicles in Household
In terms of 3 or more vehicles in household, the demographic groups most similar to Bhutanese are Fijian (22.2%, a difference of 0.040%), Finnish (22.3%, a difference of 0.16%), Chickasaw (22.2%, a difference of 0.20%), Navajo (22.3%, a difference of 0.24%), and Spaniard (22.3%, a difference of 0.30%).
| Demographics | Rating | Rank | 3 or more Vehicles in Household |
| Crow | 100.0 /100 | #54 | Exceptional 22.5% |
| Immigrants | Laos | 100.0 /100 | #55 | Exceptional 22.4% |
| Hispanics or Latinos | 100.0 /100 | #56 | Exceptional 22.4% |
| Pennsylvania Germans | 100.0 /100 | #57 | Exceptional 22.3% |
| Spaniards | 100.0 /100 | #58 | Exceptional 22.3% |
| Navajo | 100.0 /100 | #59 | Exceptional 22.3% |
| Finns | 99.9 /100 | #60 | Exceptional 22.3% |
| Bhutanese | 99.9 /100 | #61 | Exceptional 22.2% |
| Fijians | 99.9 /100 | #62 | Exceptional 22.2% |
| Chickasaw | 99.9 /100 | #63 | Exceptional 22.2% |
| Immigrants | Taiwan | 99.9 /100 | #64 | Exceptional 22.1% |
| Pima | 99.9 /100 | #65 | Exceptional 22.0% |
| Northern Europeans | 99.9 /100 | #66 | Exceptional 22.0% |
| Alaskan Athabascans | 99.9 /100 | #67 | Exceptional 21.9% |
| British | 99.9 /100 | #68 | Exceptional 21.9% |