Navajo vs Lumbee 3 or more Vehicles in Household
COMPARE
Navajo
Lumbee
3 or more Vehicles in Household
3 or more Vehicles in Household Comparison
Navajo
Lumbee
22.3%
3 OR MORE VEHICLES IN HOUSEHOLD
100.0/ 100
METRIC RATING
59th/ 347
METRIC RANK
23.1%
3 OR MORE VEHICLES IN HOUSEHOLD
100.0/ 100
METRIC RATING
28th/ 347
METRIC RANK
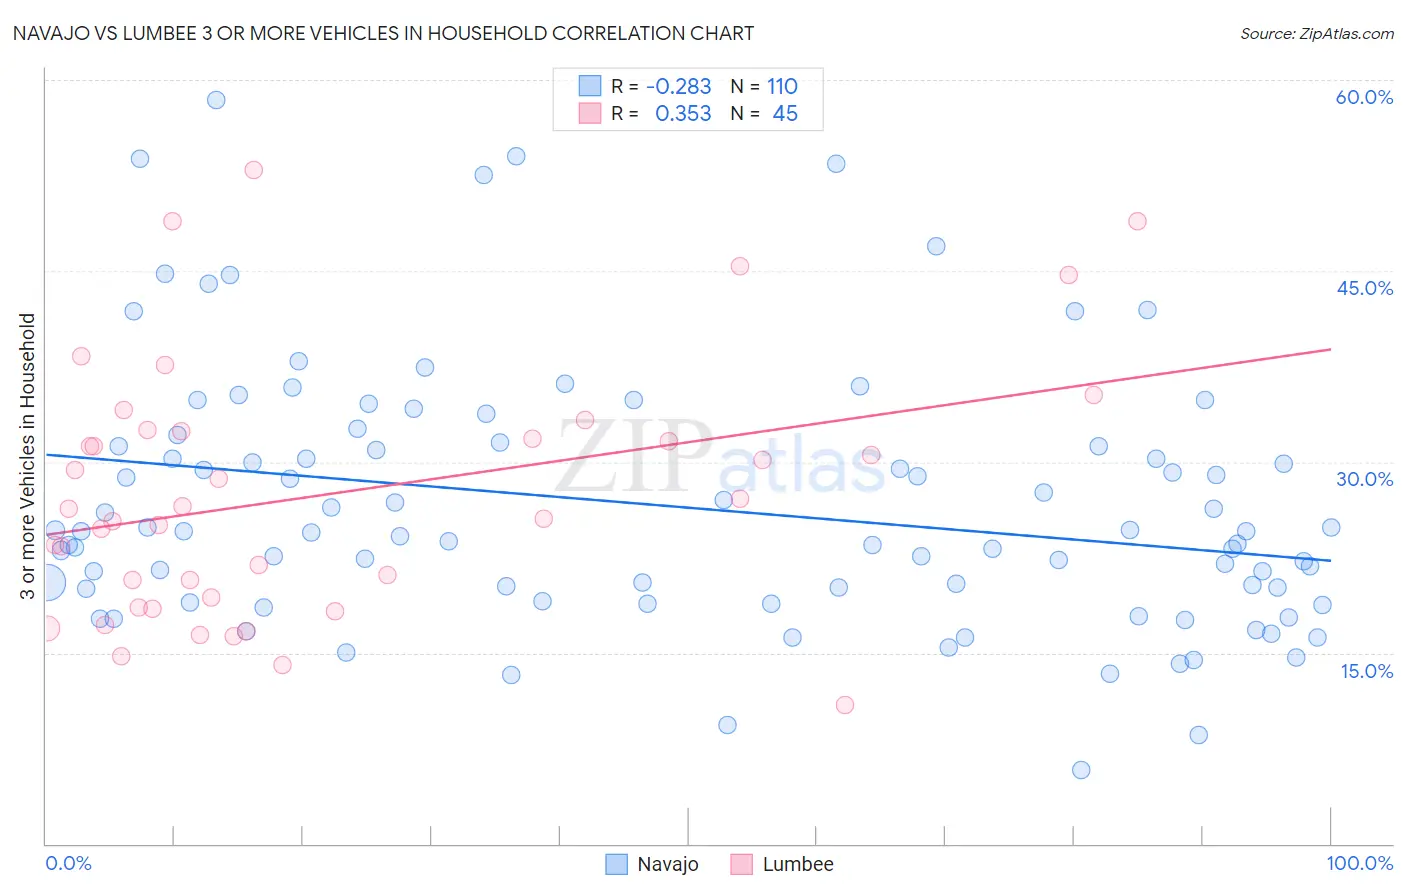
Navajo vs Lumbee 3 or more Vehicles in Household Correlation Chart
The statistical analysis conducted on geographies consisting of 224,733,620 people shows a weak negative correlation between the proportion of Navajo and percentage of households with 3 or more vehicles available in the United States with a correlation coefficient (R) of -0.283 and weighted average of 22.3%. Similarly, the statistical analysis conducted on geographies consisting of 92,258,443 people shows a mild positive correlation between the proportion of Lumbee and percentage of households with 3 or more vehicles available in the United States with a correlation coefficient (R) of 0.353 and weighted average of 23.1%, a difference of 3.8%.
3 or more Vehicles in Household Correlation Summary
| Measurement | Navajo | Lumbee |
| Minimum | 5.8% | 10.9% |
| Maximum | 58.5% | 53.0% |
| Range | 52.7% | 42.0% |
| Mean | 26.6% | 27.5% |
| Median | 24.5% | 26.3% |
| Interquartile 25% (IQ1) | 20.0% | 19.0% |
| Interquartile 75% (IQ3) | 31.2% | 32.4% |
| Interquartile Range (IQR) | 11.2% | 13.4% |
| Standard Deviation (Sample) | 10.2% | 10.0% |
| Standard Deviation (Population) | 10.1% | 9.9% |
Similar Demographics by 3 or more Vehicles in Household
Demographics Similar to Navajo by 3 or more Vehicles in Household
In terms of 3 or more vehicles in household, the demographic groups most similar to Navajo are Spaniard (22.3%, a difference of 0.060%), Finnish (22.3%, a difference of 0.090%), Pennsylvania German (22.3%, a difference of 0.19%), Bhutanese (22.2%, a difference of 0.24%), and Fijian (22.2%, a difference of 0.28%).
| Demographics | Rating | Rank | 3 or more Vehicles in Household |
| Welsh | 100.0 /100 | #52 | Exceptional 22.6% |
| Czechs | 100.0 /100 | #53 | Exceptional 22.5% |
| Crow | 100.0 /100 | #54 | Exceptional 22.5% |
| Immigrants | Laos | 100.0 /100 | #55 | Exceptional 22.4% |
| Hispanics or Latinos | 100.0 /100 | #56 | Exceptional 22.4% |
| Pennsylvania Germans | 100.0 /100 | #57 | Exceptional 22.3% |
| Spaniards | 100.0 /100 | #58 | Exceptional 22.3% |
| Navajo | 100.0 /100 | #59 | Exceptional 22.3% |
| Finns | 99.9 /100 | #60 | Exceptional 22.3% |
| Bhutanese | 99.9 /100 | #61 | Exceptional 22.2% |
| Fijians | 99.9 /100 | #62 | Exceptional 22.2% |
| Chickasaw | 99.9 /100 | #63 | Exceptional 22.2% |
| Immigrants | Taiwan | 99.9 /100 | #64 | Exceptional 22.1% |
| Pima | 99.9 /100 | #65 | Exceptional 22.0% |
| Northern Europeans | 99.9 /100 | #66 | Exceptional 22.0% |
Demographics Similar to Lumbee by 3 or more Vehicles in Household
In terms of 3 or more vehicles in household, the demographic groups most similar to Lumbee are Spanish (23.1%, a difference of 0.070%), Immigrants from South Eastern Asia (23.1%, a difference of 0.24%), Guamanian/Chamorro (23.2%, a difference of 0.33%), English (23.1%, a difference of 0.43%), and Mexican American Indian (23.3%, a difference of 0.47%).
| Demographics | Rating | Rank | 3 or more Vehicles in Household |
| Immigrants | Vietnam | 100.0 /100 | #21 | Exceptional 23.8% |
| Immigrants | Philippines | 100.0 /100 | #22 | Exceptional 23.8% |
| Scandinavians | 100.0 /100 | #23 | Exceptional 23.6% |
| Sri Lankans | 100.0 /100 | #24 | Exceptional 23.6% |
| Immigrants | Central America | 100.0 /100 | #25 | Exceptional 23.4% |
| Mexican American Indians | 100.0 /100 | #26 | Exceptional 23.3% |
| Guamanians/Chamorros | 100.0 /100 | #27 | Exceptional 23.2% |
| Lumbee | 100.0 /100 | #28 | Exceptional 23.1% |
| Spanish | 100.0 /100 | #29 | Exceptional 23.1% |
| Immigrants | South Eastern Asia | 100.0 /100 | #30 | Exceptional 23.1% |
| English | 100.0 /100 | #31 | Exceptional 23.1% |
| Pueblo | 100.0 /100 | #32 | Exceptional 23.0% |
| Spanish Americans | 100.0 /100 | #33 | Exceptional 23.0% |
| Swiss | 100.0 /100 | #34 | Exceptional 23.0% |
| Choctaw | 100.0 /100 | #35 | Exceptional 23.0% |