Immigrants from Ecuador vs Salvadoran 1 or more Vehicles in Household
COMPARE
Immigrants from Ecuador
Salvadoran
1 or more Vehicles in Household
1 or more Vehicles in Household Comparison
Immigrants from Ecuador
Salvadorans
76.2%
1 OR MORE VEHICLES IN HOUSEHOLD
0.0/ 100
METRIC RATING
333rd/ 347
METRIC RANK
90.0%
1 OR MORE VEHICLES IN HOUSEHOLD
68.7/ 100
METRIC RATING
161st/ 347
METRIC RANK
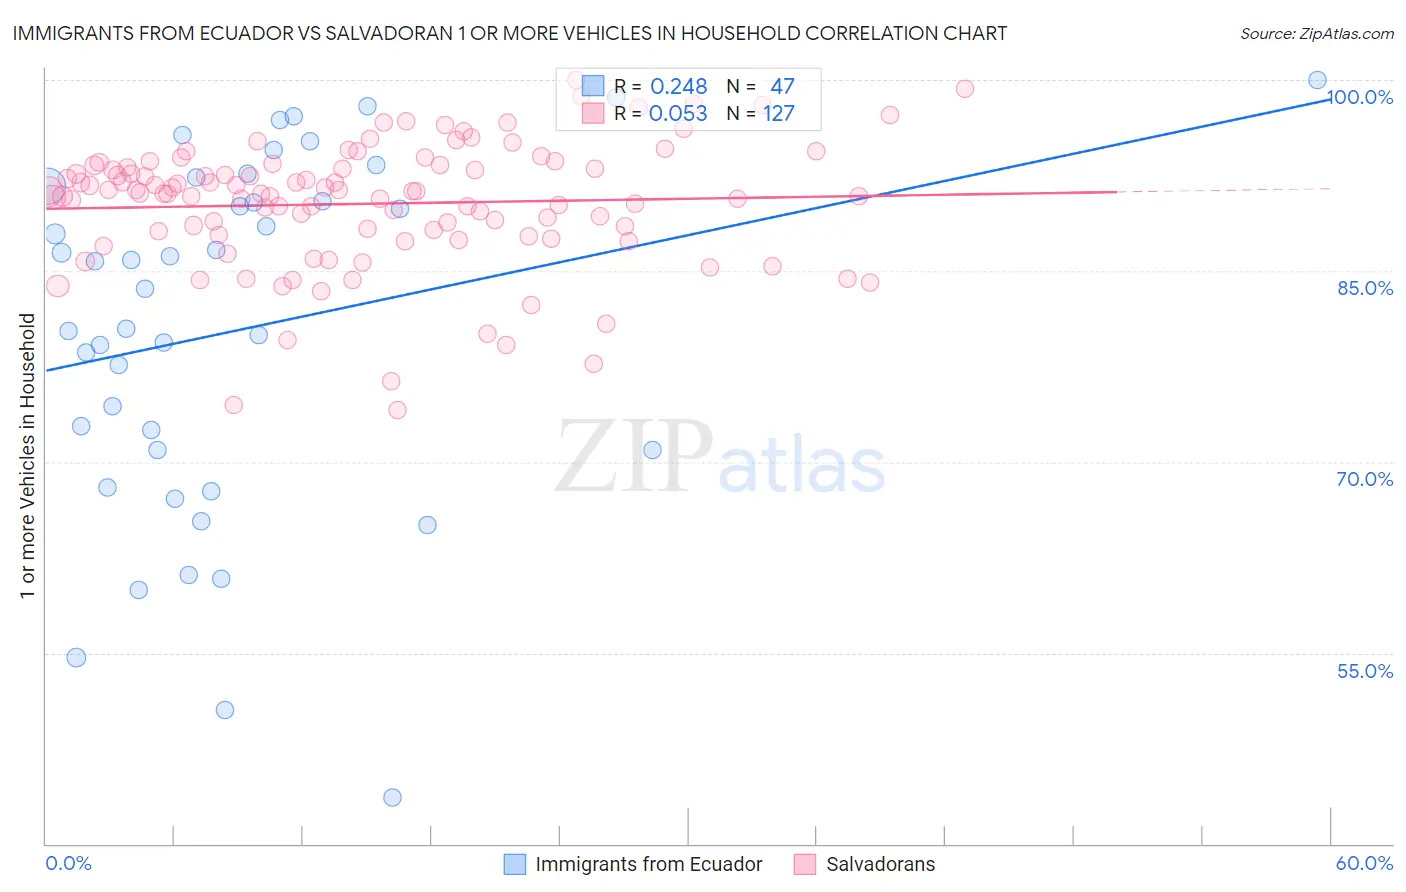
Immigrants from Ecuador vs Salvadoran 1 or more Vehicles in Household Correlation Chart
The statistical analysis conducted on geographies consisting of 270,903,190 people shows a weak positive correlation between the proportion of Immigrants from Ecuador and percentage of households with 1 or more vehicles available in the United States with a correlation coefficient (R) of 0.248 and weighted average of 76.2%. Similarly, the statistical analysis conducted on geographies consisting of 398,652,231 people shows a slight positive correlation between the proportion of Salvadorans and percentage of households with 1 or more vehicles available in the United States with a correlation coefficient (R) of 0.053 and weighted average of 90.0%, a difference of 18.0%.
1 or more Vehicles in Household Correlation Summary
| Measurement | Immigrants from Ecuador | Salvadoran |
| Minimum | 43.6% | 74.1% |
| Maximum | 100.0% | 100.0% |
| Range | 56.4% | 25.9% |
| Mean | 80.4% | 90.3% |
| Median | 83.6% | 91.1% |
| Interquartile 25% (IQ1) | 70.9% | 87.9% |
| Interquartile 75% (IQ3) | 91.7% | 93.3% |
| Interquartile Range (IQR) | 20.7% | 5.4% |
| Standard Deviation (Sample) | 13.9% | 4.9% |
| Standard Deviation (Population) | 13.7% | 4.9% |
Similar Demographics by 1 or more Vehicles in Household
Demographics Similar to Immigrants from Ecuador by 1 or more Vehicles in Household
In terms of 1 or more vehicles in household, the demographic groups most similar to Immigrants from Ecuador are Trinidadian and Tobagonian (76.3%, a difference of 0.10%), West Indian (76.4%, a difference of 0.18%), Immigrants from Trinidad and Tobago (76.8%, a difference of 0.73%), Immigrants from Dominica (77.8%, a difference of 2.1%), and Ecuadorian (77.9%, a difference of 2.2%).
| Demographics | Rating | Rank | 1 or more Vehicles in Household |
| Immigrants | West Indies | 0.0 /100 | #326 | Tragic 79.5% |
| Immigrants | Senegal | 0.0 /100 | #327 | Tragic 79.0% |
| Ecuadorians | 0.0 /100 | #328 | Tragic 77.9% |
| Immigrants | Dominica | 0.0 /100 | #329 | Tragic 77.8% |
| Immigrants | Trinidad and Tobago | 0.0 /100 | #330 | Tragic 76.8% |
| West Indians | 0.0 /100 | #331 | Tragic 76.4% |
| Trinidadians and Tobagonians | 0.0 /100 | #332 | Tragic 76.3% |
| Immigrants | Ecuador | 0.0 /100 | #333 | Tragic 76.2% |
| Immigrants | Bangladesh | 0.0 /100 | #334 | Tragic 74.3% |
| Barbadians | 0.0 /100 | #335 | Tragic 74.0% |
| Vietnamese | 0.0 /100 | #336 | Tragic 73.8% |
| Immigrants | Uzbekistan | 0.0 /100 | #337 | Tragic 73.4% |
| Inupiat | 0.0 /100 | #338 | Tragic 71.5% |
| Guyanese | 0.0 /100 | #339 | Tragic 70.8% |
| Dominicans | 0.0 /100 | #340 | Tragic 70.7% |
Demographics Similar to Salvadorans by 1 or more Vehicles in Household
In terms of 1 or more vehicles in household, the demographic groups most similar to Salvadorans are Immigrants from Indonesia (90.0%, a difference of 0.0%), South African (90.0%, a difference of 0.020%), Spanish American Indian (89.9%, a difference of 0.030%), Brazilian (90.0%, a difference of 0.040%), and Immigrants from Congo (90.0%, a difference of 0.050%).
| Demographics | Rating | Rank | 1 or more Vehicles in Household |
| Immigrants | Uganda | 73.8 /100 | #154 | Good 90.1% |
| Immigrants | Immigrants | 73.6 /100 | #155 | Good 90.1% |
| Australians | 72.4 /100 | #156 | Good 90.0% |
| Immigrants | Congo | 71.2 /100 | #157 | Good 90.0% |
| Brazilians | 71.0 /100 | #158 | Good 90.0% |
| South Africans | 69.7 /100 | #159 | Good 90.0% |
| Immigrants | Indonesia | 68.8 /100 | #160 | Good 90.0% |
| Salvadorans | 68.7 /100 | #161 | Good 90.0% |
| Spanish American Indians | 67.0 /100 | #162 | Good 89.9% |
| Immigrants | Austria | 65.5 /100 | #163 | Good 89.9% |
| Comanche | 63.4 /100 | #164 | Good 89.9% |
| Immigrants | Saudi Arabia | 62.6 /100 | #165 | Good 89.9% |
| Immigrants | Middle Africa | 62.2 /100 | #166 | Good 89.9% |
| Immigrants | Latin America | 60.3 /100 | #167 | Good 89.8% |
| Immigrants | Cambodia | 60.1 /100 | #168 | Good 89.8% |