Immigrants from Greece vs Salvadoran Seniors Poverty Over the Age of 65
COMPARE
Immigrants from Greece
Salvadoran
Seniors Poverty Over the Age of 65
Seniors Poverty Over the Age of 65 Comparison
Immigrants from Greece
Salvadorans
10.6%
SENIORS POVERTY OVER THE AGE OF 65
79.0/ 100
METRIC RATING
147th/ 347
METRIC RANK
12.8%
SENIORS POVERTY OVER THE AGE OF 65
0.0/ 100
METRIC RATING
274th/ 347
METRIC RANK
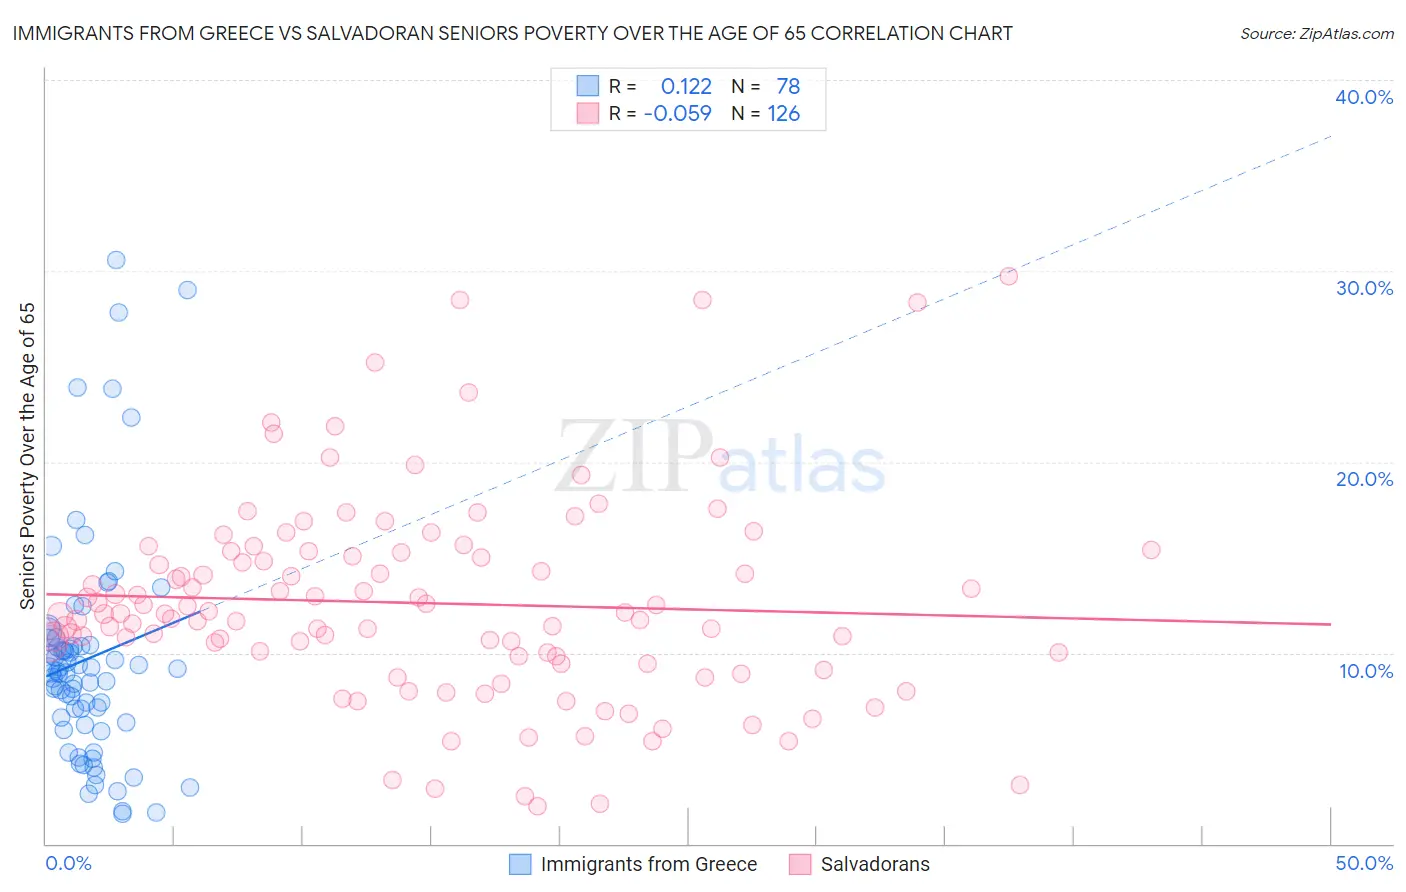
Immigrants from Greece vs Salvadoran Seniors Poverty Over the Age of 65 Correlation Chart
The statistical analysis conducted on geographies consisting of 216,657,088 people shows a poor positive correlation between the proportion of Immigrants from Greece and poverty level among seniors over the age of 65 in the United States with a correlation coefficient (R) of 0.122 and weighted average of 10.6%. Similarly, the statistical analysis conducted on geographies consisting of 397,362,950 people shows a slight negative correlation between the proportion of Salvadorans and poverty level among seniors over the age of 65 in the United States with a correlation coefficient (R) of -0.059 and weighted average of 12.8%, a difference of 20.7%.
Seniors Poverty Over the Age of 65 Correlation Summary
| Measurement | Immigrants from Greece | Salvadoran |
| Minimum | 1.6% | 2.0% |
| Maximum | 30.6% | 29.7% |
| Range | 29.0% | 27.7% |
| Mean | 9.7% | 12.6% |
| Median | 9.0% | 12.0% |
| Interquartile 25% (IQ1) | 6.4% | 9.8% |
| Interquartile 75% (IQ3) | 10.4% | 15.3% |
| Interquartile Range (IQR) | 4.0% | 5.5% |
| Standard Deviation (Sample) | 5.9% | 5.3% |
| Standard Deviation (Population) | 5.9% | 5.3% |
Similar Demographics by Seniors Poverty Over the Age of 65
Demographics Similar to Immigrants from Greece by Seniors Poverty Over the Age of 65
In terms of seniors poverty over the age of 65, the demographic groups most similar to Immigrants from Greece are Alaskan Athabascan (10.6%, a difference of 0.020%), Laotian (10.6%, a difference of 0.12%), American (10.6%, a difference of 0.13%), Immigrants from Cameroon (10.6%, a difference of 0.13%), and Immigrants from Switzerland (10.6%, a difference of 0.23%).
| Demographics | Rating | Rank | Seniors Poverty Over the Age of 65 |
| Immigrants | Kenya | 83.4 /100 | #140 | Excellent 10.5% |
| Immigrants | Europe | 83.3 /100 | #141 | Excellent 10.5% |
| Osage | 82.8 /100 | #142 | Excellent 10.6% |
| Immigrants | Asia | 80.8 /100 | #143 | Excellent 10.6% |
| Iraqis | 80.7 /100 | #144 | Excellent 10.6% |
| Laotians | 79.9 /100 | #145 | Good 10.6% |
| Alaskan Athabascans | 79.1 /100 | #146 | Good 10.6% |
| Immigrants | Greece | 79.0 /100 | #147 | Good 10.6% |
| Americans | 78.1 /100 | #148 | Good 10.6% |
| Immigrants | Cameroon | 78.1 /100 | #149 | Good 10.6% |
| Immigrants | Switzerland | 77.3 /100 | #150 | Good 10.6% |
| Spanish | 76.8 /100 | #151 | Good 10.6% |
| Immigrants | Egypt | 76.5 /100 | #152 | Good 10.6% |
| Fijians | 75.6 /100 | #153 | Good 10.7% |
| Immigrants | Saudi Arabia | 74.9 /100 | #154 | Good 10.7% |
Demographics Similar to Salvadorans by Seniors Poverty Over the Age of 65
In terms of seniors poverty over the age of 65, the demographic groups most similar to Salvadorans are Kiowa (12.8%, a difference of 0.25%), Immigrants from Uruguay (12.8%, a difference of 0.37%), Immigrants from Ghana (12.8%, a difference of 0.40%), Immigrants from South America (12.7%, a difference of 0.67%), and Immigrants from Colombia (12.9%, a difference of 0.67%).
| Demographics | Rating | Rank | Seniors Poverty Over the Age of 65 |
| Blackfeet | 0.1 /100 | #267 | Tragic 12.6% |
| Immigrants | Somalia | 0.1 /100 | #268 | Tragic 12.6% |
| Immigrants | Venezuela | 0.1 /100 | #269 | Tragic 12.7% |
| Immigrants | South America | 0.1 /100 | #270 | Tragic 12.7% |
| Immigrants | Ghana | 0.1 /100 | #271 | Tragic 12.8% |
| Immigrants | Uruguay | 0.1 /100 | #272 | Tragic 12.8% |
| Kiowa | 0.0 /100 | #273 | Tragic 12.8% |
| Salvadorans | 0.0 /100 | #274 | Tragic 12.8% |
| Immigrants | Colombia | 0.0 /100 | #275 | Tragic 12.9% |
| Immigrants | Azores | 0.0 /100 | #276 | Tragic 12.9% |
| Paiute | 0.0 /100 | #277 | Tragic 12.9% |
| Immigrants | Bahamas | 0.0 /100 | #278 | Tragic 13.0% |
| Mexicans | 0.0 /100 | #279 | Tragic 13.1% |
| Yuman | 0.0 /100 | #280 | Tragic 13.1% |
| Immigrants | El Salvador | 0.0 /100 | #281 | Tragic 13.1% |