Immigrants from Moldova vs Salvadoran 1 or more Vehicles in Household
COMPARE
Immigrants from Moldova
Salvadoran
1 or more Vehicles in Household
1 or more Vehicles in Household Comparison
Immigrants from Moldova
Salvadorans
90.2%
1 OR MORE VEHICLES IN HOUSEHOLD
83.1/ 100
METRIC RATING
141st/ 347
METRIC RANK
90.0%
1 OR MORE VEHICLES IN HOUSEHOLD
68.7/ 100
METRIC RATING
161st/ 347
METRIC RANK
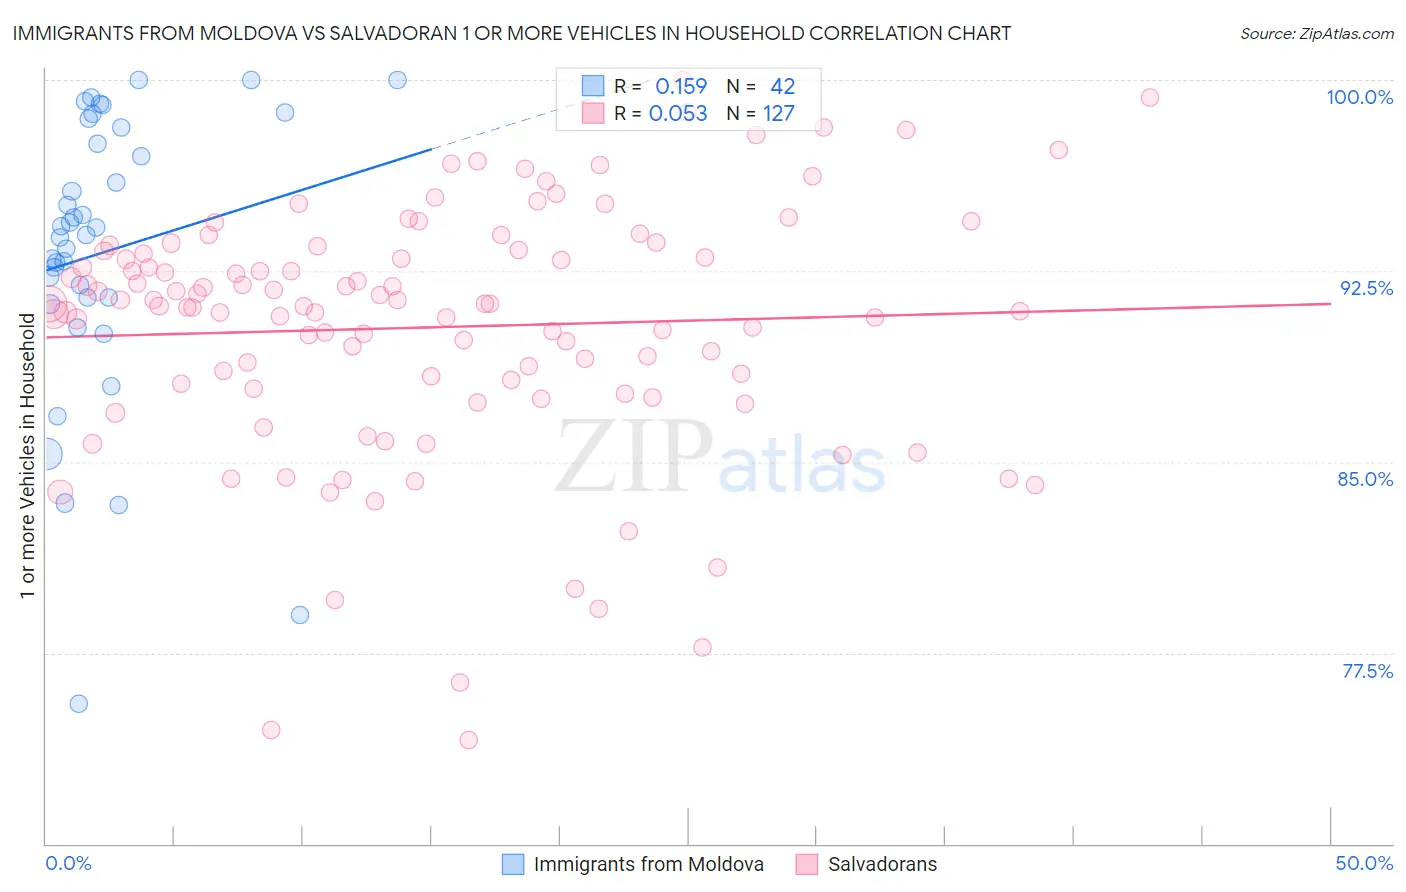
Immigrants from Moldova vs Salvadoran 1 or more Vehicles in Household Correlation Chart
The statistical analysis conducted on geographies consisting of 124,288,991 people shows a poor positive correlation between the proportion of Immigrants from Moldova and percentage of households with 1 or more vehicles available in the United States with a correlation coefficient (R) of 0.159 and weighted average of 90.2%. Similarly, the statistical analysis conducted on geographies consisting of 398,652,231 people shows a slight positive correlation between the proportion of Salvadorans and percentage of households with 1 or more vehicles available in the United States with a correlation coefficient (R) of 0.053 and weighted average of 90.0%, a difference of 0.31%.
1 or more Vehicles in Household Correlation Summary
| Measurement | Immigrants from Moldova | Salvadoran |
| Minimum | 75.5% | 74.1% |
| Maximum | 100.0% | 100.0% |
| Range | 24.5% | 25.9% |
| Mean | 93.2% | 90.3% |
| Median | 94.1% | 91.1% |
| Interquartile 25% (IQ1) | 91.4% | 87.9% |
| Interquartile 75% (IQ3) | 98.1% | 93.3% |
| Interquartile Range (IQR) | 6.7% | 5.4% |
| Standard Deviation (Sample) | 5.7% | 4.9% |
| Standard Deviation (Population) | 5.6% | 4.9% |
Demographics Similar to Immigrants from Moldova and Salvadorans by 1 or more Vehicles in Household
In terms of 1 or more vehicles in household, the demographic groups most similar to Immigrants from Moldova are Immigrants from Lithuania (90.2%, a difference of 0.0%), Immigrants from Bahamas (90.2%, a difference of 0.040%), Immigrants from Zimbabwe (90.2%, a difference of 0.040%), Sioux (90.2%, a difference of 0.050%), and Bahamian (90.2%, a difference of 0.070%). Similarly, the demographic groups most similar to Salvadorans are Immigrants from Indonesia (90.0%, a difference of 0.0%), South African (90.0%, a difference of 0.020%), Brazilian (90.0%, a difference of 0.040%), Immigrants from Congo (90.0%, a difference of 0.050%), and Australian (90.0%, a difference of 0.070%).
| Demographics | Rating | Rank | 1 or more Vehicles in Household |
| Immigrants | Moldova | 83.1 /100 | #141 | Excellent 90.2% |
| Immigrants | Lithuania | 83.0 /100 | #142 | Excellent 90.2% |
| Immigrants | Bahamas | 81.5 /100 | #143 | Excellent 90.2% |
| Immigrants | Zimbabwe | 81.5 /100 | #144 | Excellent 90.2% |
| Sioux | 81.3 /100 | #145 | Excellent 90.2% |
| Bahamians | 80.5 /100 | #146 | Excellent 90.2% |
| Chileans | 79.8 /100 | #147 | Good 90.2% |
| Immigrants | Eastern Africa | 78.2 /100 | #148 | Good 90.1% |
| Immigrants | Nicaragua | 76.7 /100 | #149 | Good 90.1% |
| Immigrants | Micronesia | 75.9 /100 | #150 | Good 90.1% |
| Immigrants | Bosnia and Herzegovina | 75.4 /100 | #151 | Good 90.1% |
| Tlingit-Haida | 74.3 /100 | #152 | Good 90.1% |
| New Zealanders | 73.8 /100 | #153 | Good 90.1% |
| Immigrants | Uganda | 73.8 /100 | #154 | Good 90.1% |
| Immigrants | Immigrants | 73.6 /100 | #155 | Good 90.1% |
| Australians | 72.4 /100 | #156 | Good 90.0% |
| Immigrants | Congo | 71.2 /100 | #157 | Good 90.0% |
| Brazilians | 71.0 /100 | #158 | Good 90.0% |
| South Africans | 69.7 /100 | #159 | Good 90.0% |
| Immigrants | Indonesia | 68.8 /100 | #160 | Good 90.0% |
| Salvadorans | 68.7 /100 | #161 | Good 90.0% |