Immigrants from Jordan vs Salvadoran 1 or more Vehicles in Household
COMPARE
Immigrants from Jordan
Salvadoran
1 or more Vehicles in Household
1 or more Vehicles in Household Comparison
Immigrants from Jordan
Salvadorans
91.4%
1 OR MORE VEHICLES IN HOUSEHOLD
99.2/ 100
METRIC RATING
91st/ 347
METRIC RANK
90.0%
1 OR MORE VEHICLES IN HOUSEHOLD
68.7/ 100
METRIC RATING
161st/ 347
METRIC RANK
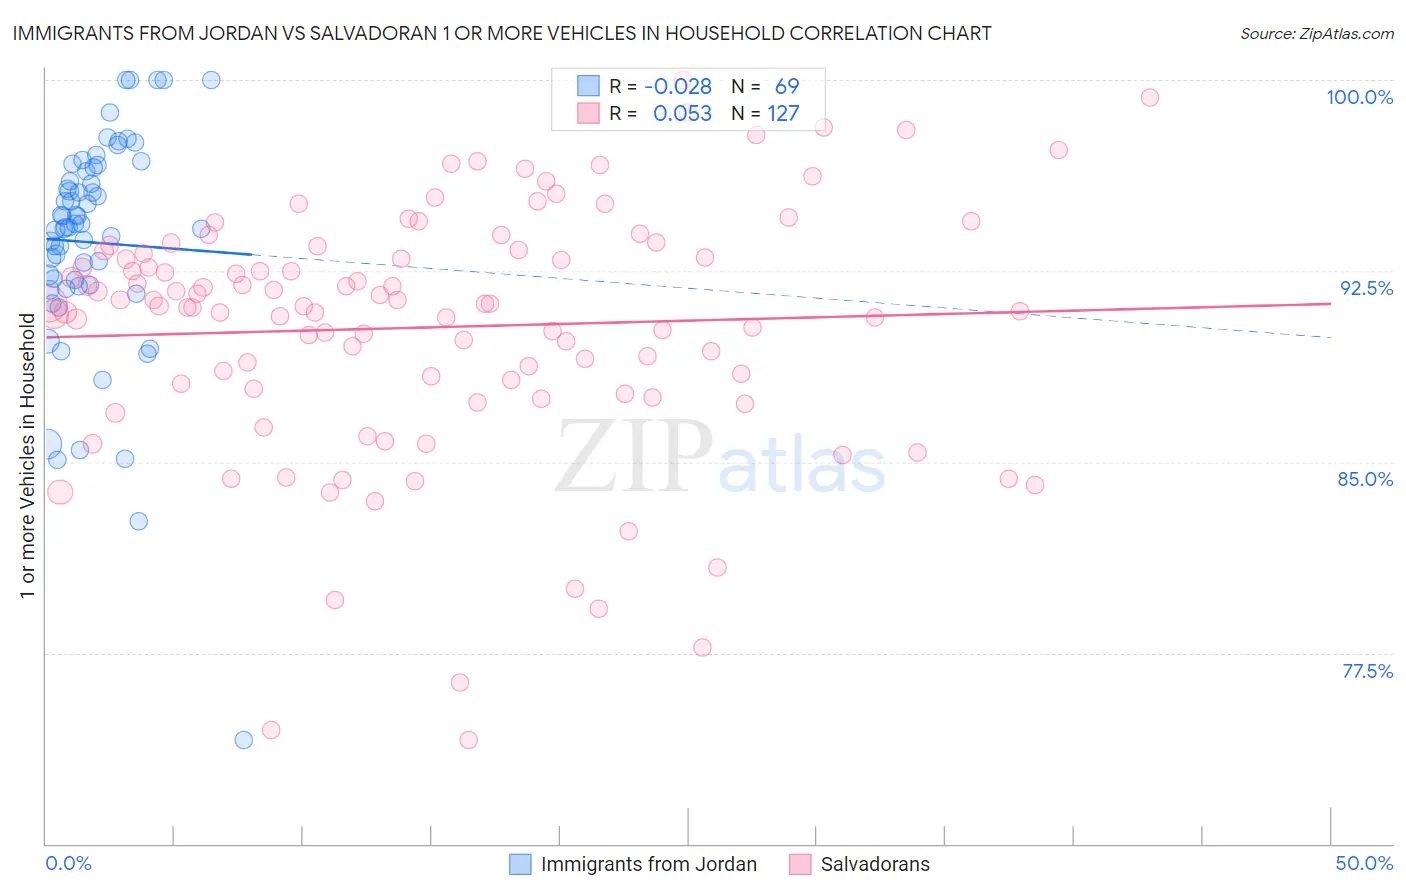
Immigrants from Jordan vs Salvadoran 1 or more Vehicles in Household Correlation Chart
The statistical analysis conducted on geographies consisting of 181,238,017 people shows no correlation between the proportion of Immigrants from Jordan and percentage of households with 1 or more vehicles available in the United States with a correlation coefficient (R) of -0.028 and weighted average of 91.4%. Similarly, the statistical analysis conducted on geographies consisting of 398,652,231 people shows a slight positive correlation between the proportion of Salvadorans and percentage of households with 1 or more vehicles available in the United States with a correlation coefficient (R) of 0.053 and weighted average of 90.0%, a difference of 1.6%.
1 or more Vehicles in Household Correlation Summary
| Measurement | Immigrants from Jordan | Salvadoran |
| Minimum | 74.1% | 74.1% |
| Maximum | 100.0% | 100.0% |
| Range | 25.9% | 25.9% |
| Mean | 93.6% | 90.3% |
| Median | 94.2% | 91.1% |
| Interquartile 25% (IQ1) | 91.9% | 87.9% |
| Interquartile 75% (IQ3) | 96.5% | 93.3% |
| Interquartile Range (IQR) | 4.5% | 5.4% |
| Standard Deviation (Sample) | 4.4% | 4.9% |
| Standard Deviation (Population) | 4.4% | 4.9% |
Similar Demographics by 1 or more Vehicles in Household
Demographics Similar to Immigrants from Jordan by 1 or more Vehicles in Household
In terms of 1 or more vehicles in household, the demographic groups most similar to Immigrants from Jordan are Spanish American (91.4%, a difference of 0.0%), Bangladeshi (91.4%, a difference of 0.0%), Immigrants from Canada (91.4%, a difference of 0.0%), Immigrants from Germany (91.4%, a difference of 0.010%), and Bhutanese (91.4%, a difference of 0.010%).
| Demographics | Rating | Rank | 1 or more Vehicles in Household |
| Jordanians | 99.3 /100 | #84 | Exceptional 91.4% |
| Tsimshian | 99.3 /100 | #85 | Exceptional 91.4% |
| Osage | 99.2 /100 | #86 | Exceptional 91.4% |
| Immigrants | Germany | 99.2 /100 | #87 | Exceptional 91.4% |
| Spanish Americans | 99.2 /100 | #88 | Exceptional 91.4% |
| Bangladeshis | 99.2 /100 | #89 | Exceptional 91.4% |
| Immigrants | Canada | 99.2 /100 | #90 | Exceptional 91.4% |
| Immigrants | Jordan | 99.2 /100 | #91 | Exceptional 91.4% |
| Bhutanese | 99.2 /100 | #92 | Exceptional 91.4% |
| Immigrants | North America | 99.2 /100 | #93 | Exceptional 91.4% |
| Immigrants | Cuba | 99.1 /100 | #94 | Exceptional 91.3% |
| Austrians | 99.0 /100 | #95 | Exceptional 91.3% |
| Potawatomi | 99.0 /100 | #96 | Exceptional 91.3% |
| Pakistanis | 99.0 /100 | #97 | Exceptional 91.3% |
| Slavs | 98.7 /100 | #98 | Exceptional 91.2% |
Demographics Similar to Salvadorans by 1 or more Vehicles in Household
In terms of 1 or more vehicles in household, the demographic groups most similar to Salvadorans are Immigrants from Indonesia (90.0%, a difference of 0.0%), South African (90.0%, a difference of 0.020%), Spanish American Indian (89.9%, a difference of 0.030%), Brazilian (90.0%, a difference of 0.040%), and Immigrants from Congo (90.0%, a difference of 0.050%).
| Demographics | Rating | Rank | 1 or more Vehicles in Household |
| Immigrants | Uganda | 73.8 /100 | #154 | Good 90.1% |
| Immigrants | Immigrants | 73.6 /100 | #155 | Good 90.1% |
| Australians | 72.4 /100 | #156 | Good 90.0% |
| Immigrants | Congo | 71.2 /100 | #157 | Good 90.0% |
| Brazilians | 71.0 /100 | #158 | Good 90.0% |
| South Africans | 69.7 /100 | #159 | Good 90.0% |
| Immigrants | Indonesia | 68.8 /100 | #160 | Good 90.0% |
| Salvadorans | 68.7 /100 | #161 | Good 90.0% |
| Spanish American Indians | 67.0 /100 | #162 | Good 89.9% |
| Immigrants | Austria | 65.5 /100 | #163 | Good 89.9% |
| Comanche | 63.4 /100 | #164 | Good 89.9% |
| Immigrants | Saudi Arabia | 62.6 /100 | #165 | Good 89.9% |
| Immigrants | Middle Africa | 62.2 /100 | #166 | Good 89.9% |
| Immigrants | Latin America | 60.3 /100 | #167 | Good 89.8% |
| Immigrants | Cambodia | 60.1 /100 | #168 | Good 89.8% |