Immigrants from Belgium vs Immigrants from Moldova 2 or more Vehicles in Household
COMPARE
Immigrants from Belgium
Immigrants from Moldova
2 or more Vehicles in Household
2 or more Vehicles in Household Comparison
Immigrants from Belgium
Immigrants from Moldova
54.3%
2 OR MORE VEHICLES IN HOUSEHOLD
13.7/ 100
METRIC RATING
204th/ 347
METRIC RANK
56.1%
2 OR MORE VEHICLES IN HOUSEHOLD
80.2/ 100
METRIC RATING
148th/ 347
METRIC RANK
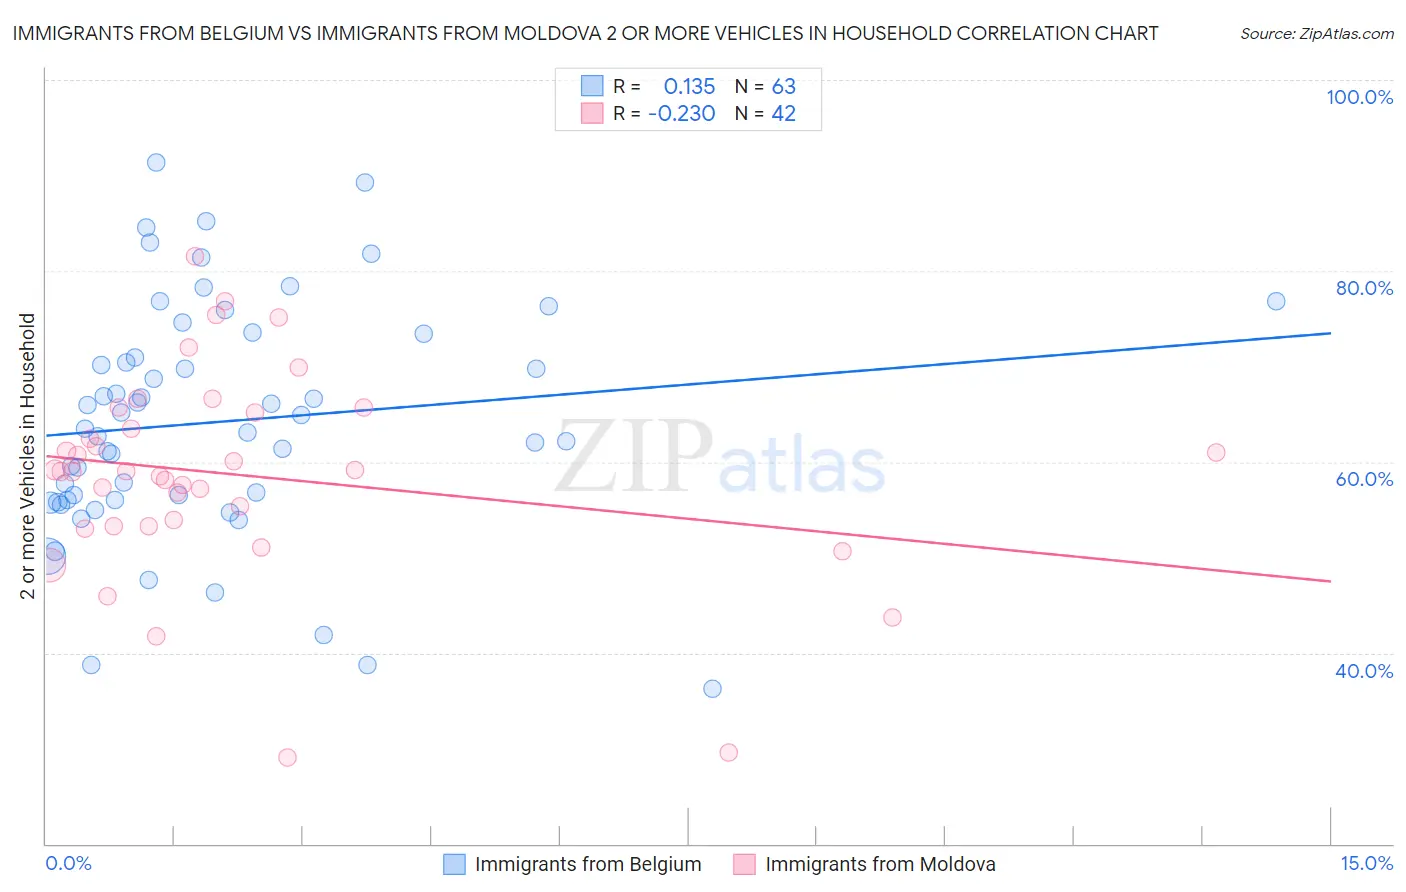
Immigrants from Belgium vs Immigrants from Moldova 2 or more Vehicles in Household Correlation Chart
The statistical analysis conducted on geographies consisting of 146,670,749 people shows a poor positive correlation between the proportion of Immigrants from Belgium and percentage of households with 2 or more vehicles available in the United States with a correlation coefficient (R) of 0.135 and weighted average of 54.3%. Similarly, the statistical analysis conducted on geographies consisting of 124,285,245 people shows a weak negative correlation between the proportion of Immigrants from Moldova and percentage of households with 2 or more vehicles available in the United States with a correlation coefficient (R) of -0.230 and weighted average of 56.1%, a difference of 3.3%.
2 or more Vehicles in Household Correlation Summary
| Measurement | Immigrants from Belgium | Immigrants from Moldova |
| Minimum | 36.2% | 29.0% |
| Maximum | 91.3% | 81.6% |
| Range | 55.1% | 52.5% |
| Mean | 64.2% | 58.6% |
| Median | 63.5% | 59.0% |
| Interquartile 25% (IQ1) | 56.0% | 53.2% |
| Interquartile 75% (IQ3) | 73.5% | 65.1% |
| Interquartile Range (IQR) | 17.4% | 11.9% |
| Standard Deviation (Sample) | 12.3% | 10.8% |
| Standard Deviation (Population) | 12.2% | 10.7% |
Similar Demographics by 2 or more Vehicles in Household
Demographics Similar to Immigrants from Belgium by 2 or more Vehicles in Household
In terms of 2 or more vehicles in household, the demographic groups most similar to Immigrants from Belgium are Cheyenne (54.3%, a difference of 0.010%), Immigrants from Peru (54.4%, a difference of 0.050%), Immigrants from Latin America (54.3%, a difference of 0.060%), Turkish (54.3%, a difference of 0.070%), and Immigrants from North Macedonia (54.4%, a difference of 0.090%).
| Demographics | Rating | Rank | 2 or more Vehicles in Household |
| Argentineans | 17.5 /100 | #197 | Poor 54.5% |
| Carpatho Rusyns | 16.2 /100 | #198 | Poor 54.4% |
| Immigrants | Norway | 15.9 /100 | #199 | Poor 54.4% |
| Houma | 15.8 /100 | #200 | Poor 54.4% |
| Immigrants | Italy | 15.5 /100 | #201 | Poor 54.4% |
| Immigrants | North Macedonia | 14.9 /100 | #202 | Poor 54.4% |
| Immigrants | Peru | 14.3 /100 | #203 | Poor 54.4% |
| Immigrants | Belgium | 13.7 /100 | #204 | Poor 54.3% |
| Cheyenne | 13.6 /100 | #205 | Poor 54.3% |
| Immigrants | Latin America | 13.1 /100 | #206 | Poor 54.3% |
| Turks | 13.0 /100 | #207 | Poor 54.3% |
| Egyptians | 12.0 /100 | #208 | Poor 54.3% |
| Immigrants | Bulgaria | 12.0 /100 | #209 | Poor 54.3% |
| Immigrants | Saudi Arabia | 11.3 /100 | #210 | Poor 54.2% |
| Immigrants | Hungary | 11.3 /100 | #211 | Poor 54.2% |
Demographics Similar to Immigrants from Moldova by 2 or more Vehicles in Household
In terms of 2 or more vehicles in household, the demographic groups most similar to Immigrants from Moldova are Serbian (56.1%, a difference of 0.0%), Chilean (56.1%, a difference of 0.0%), Nicaraguan (56.1%, a difference of 0.020%), Venezuelan (56.1%, a difference of 0.030%), and Syrian (56.2%, a difference of 0.060%).
| Demographics | Rating | Rank | 2 or more Vehicles in Household |
| Immigrants | Cambodia | 83.6 /100 | #141 | Excellent 56.2% |
| South Africans | 83.1 /100 | #142 | Excellent 56.2% |
| Seminole | 81.7 /100 | #143 | Excellent 56.2% |
| Immigrants | Syria | 81.4 /100 | #144 | Excellent 56.2% |
| Syrians | 81.2 /100 | #145 | Excellent 56.2% |
| Venezuelans | 80.7 /100 | #146 | Excellent 56.1% |
| Serbians | 80.3 /100 | #147 | Excellent 56.1% |
| Immigrants | Moldova | 80.2 /100 | #148 | Excellent 56.1% |
| Chileans | 80.2 /100 | #149 | Excellent 56.1% |
| Nicaraguans | 79.9 /100 | #150 | Good 56.1% |
| Immigrants | Northern Europe | 78.7 /100 | #151 | Good 56.1% |
| Immigrants | Pakistan | 78.1 /100 | #152 | Good 56.1% |
| Lumbee | 71.9 /100 | #153 | Good 55.9% |
| Ukrainians | 70.8 /100 | #154 | Good 55.8% |
| Immigrants | Venezuela | 70.7 /100 | #155 | Good 55.8% |