Immigrants from Belgium vs Immigrants from Grenada 2 or more Vehicles in Household
COMPARE
Immigrants from Belgium
Immigrants from Grenada
2 or more Vehicles in Household
2 or more Vehicles in Household Comparison
Immigrants from Belgium
Immigrants from Grenada
54.3%
2 OR MORE VEHICLES IN HOUSEHOLD
13.7/ 100
METRIC RATING
204th/ 347
METRIC RANK
28.7%
2 OR MORE VEHICLES IN HOUSEHOLD
0.0/ 100
METRIC RATING
347th/ 347
METRIC RANK
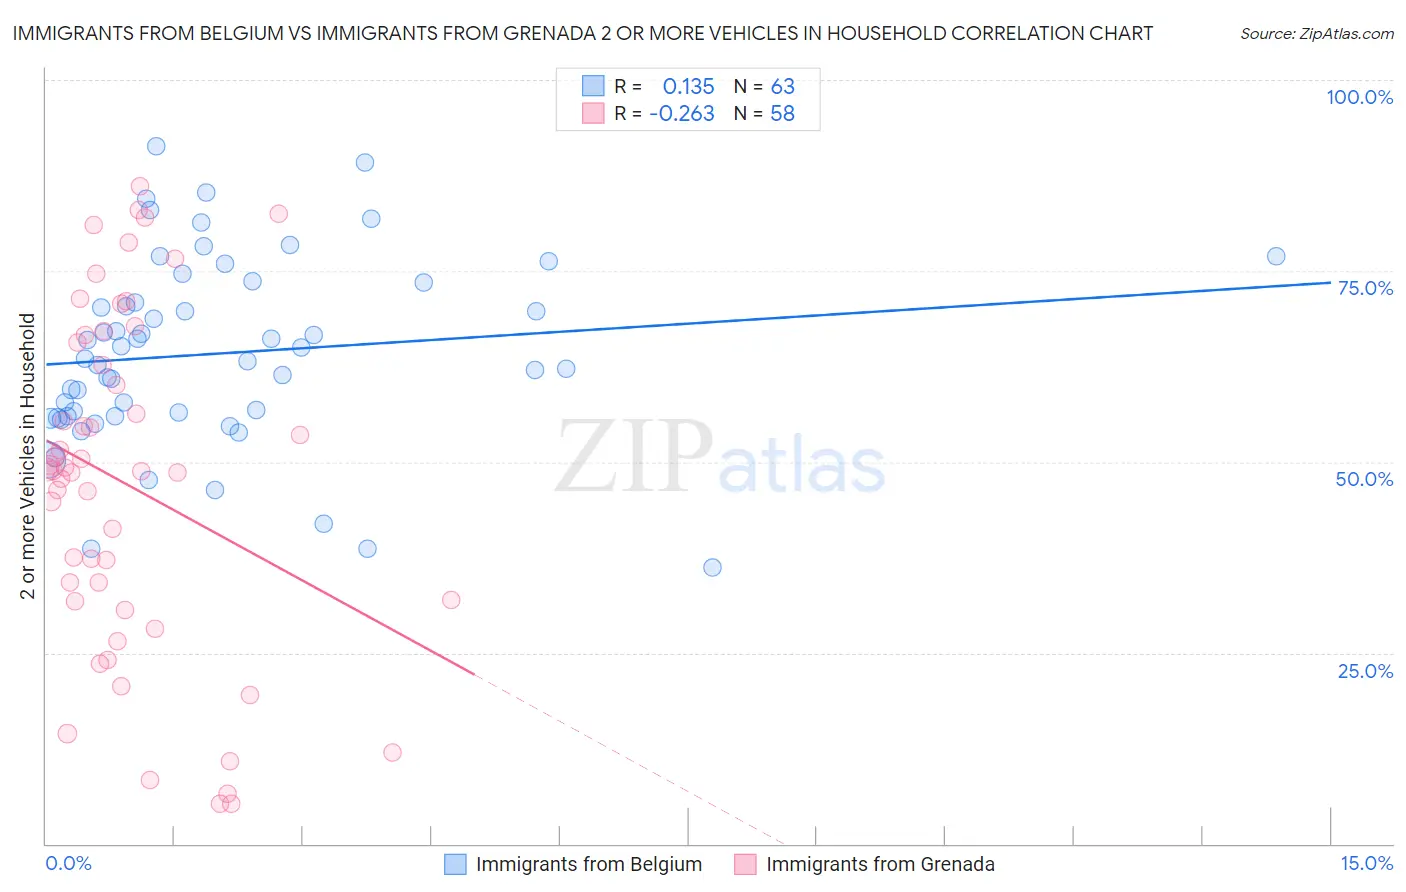
Immigrants from Belgium vs Immigrants from Grenada 2 or more Vehicles in Household Correlation Chart
The statistical analysis conducted on geographies consisting of 146,670,749 people shows a poor positive correlation between the proportion of Immigrants from Belgium and percentage of households with 2 or more vehicles available in the United States with a correlation coefficient (R) of 0.135 and weighted average of 54.3%. Similarly, the statistical analysis conducted on geographies consisting of 67,200,374 people shows a weak negative correlation between the proportion of Immigrants from Grenada and percentage of households with 2 or more vehicles available in the United States with a correlation coefficient (R) of -0.263 and weighted average of 28.7%, a difference of 89.6%.
2 or more Vehicles in Household Correlation Summary
| Measurement | Immigrants from Belgium | Immigrants from Grenada |
| Minimum | 36.2% | 5.2% |
| Maximum | 91.3% | 86.2% |
| Range | 55.1% | 81.0% |
| Mean | 64.2% | 46.9% |
| Median | 63.5% | 48.8% |
| Interquartile 25% (IQ1) | 56.0% | 31.8% |
| Interquartile 75% (IQ3) | 73.5% | 65.6% |
| Interquartile Range (IQR) | 17.4% | 33.8% |
| Standard Deviation (Sample) | 12.3% | 22.2% |
| Standard Deviation (Population) | 12.2% | 22.0% |
Similar Demographics by 2 or more Vehicles in Household
Demographics Similar to Immigrants from Belgium by 2 or more Vehicles in Household
In terms of 2 or more vehicles in household, the demographic groups most similar to Immigrants from Belgium are Cheyenne (54.3%, a difference of 0.010%), Immigrants from Peru (54.4%, a difference of 0.050%), Immigrants from Latin America (54.3%, a difference of 0.060%), Turkish (54.3%, a difference of 0.070%), and Immigrants from North Macedonia (54.4%, a difference of 0.090%).
| Demographics | Rating | Rank | 2 or more Vehicles in Household |
| Argentineans | 17.5 /100 | #197 | Poor 54.5% |
| Carpatho Rusyns | 16.2 /100 | #198 | Poor 54.4% |
| Immigrants | Norway | 15.9 /100 | #199 | Poor 54.4% |
| Houma | 15.8 /100 | #200 | Poor 54.4% |
| Immigrants | Italy | 15.5 /100 | #201 | Poor 54.4% |
| Immigrants | North Macedonia | 14.9 /100 | #202 | Poor 54.4% |
| Immigrants | Peru | 14.3 /100 | #203 | Poor 54.4% |
| Immigrants | Belgium | 13.7 /100 | #204 | Poor 54.3% |
| Cheyenne | 13.6 /100 | #205 | Poor 54.3% |
| Immigrants | Latin America | 13.1 /100 | #206 | Poor 54.3% |
| Turks | 13.0 /100 | #207 | Poor 54.3% |
| Egyptians | 12.0 /100 | #208 | Poor 54.3% |
| Immigrants | Bulgaria | 12.0 /100 | #209 | Poor 54.3% |
| Immigrants | Saudi Arabia | 11.3 /100 | #210 | Poor 54.2% |
| Immigrants | Hungary | 11.3 /100 | #211 | Poor 54.2% |
Demographics Similar to Immigrants from Grenada by 2 or more Vehicles in Household
In terms of 2 or more vehicles in household, the demographic groups most similar to Immigrants from Grenada are Immigrants from St. Vincent and the Grenadines (31.0%, a difference of 8.1%), Immigrants from Dominican Republic (33.2%, a difference of 16.0%), Yup'ik (34.9%, a difference of 21.9%), Immigrants from Guyana (35.0%, a difference of 22.1%), and Dominican (35.3%, a difference of 23.2%).
| Demographics | Rating | Rank | 2 or more Vehicles in Household |
| Immigrants | Ecuador | 0.0 /100 | #333 | Tragic 40.5% |
| Immigrants | Trinidad and Tobago | 0.0 /100 | #334 | Tragic 40.3% |
| Immigrants | Bangladesh | 0.0 /100 | #335 | Tragic 38.8% |
| Vietnamese | 0.0 /100 | #336 | Tragic 38.5% |
| Barbadians | 0.0 /100 | #337 | Tragic 38.3% |
| Immigrants | Uzbekistan | 0.0 /100 | #338 | Tragic 37.9% |
| Immigrants | Barbados | 0.0 /100 | #339 | Tragic 35.8% |
| British West Indians | 0.0 /100 | #340 | Tragic 35.4% |
| Guyanese | 0.0 /100 | #341 | Tragic 35.4% |
| Dominicans | 0.0 /100 | #342 | Tragic 35.3% |
| Immigrants | Guyana | 0.0 /100 | #343 | Tragic 35.0% |
| Yup'ik | 0.0 /100 | #344 | Tragic 34.9% |
| Immigrants | Dominican Republic | 0.0 /100 | #345 | Tragic 33.2% |
| Immigrants | St. Vincent and the Grenadines | 0.0 /100 | #346 | Tragic 31.0% |
| Immigrants | Grenada | 0.0 /100 | #347 | Tragic 28.7% |