Immigrants from Belgium vs Menominee 2 or more Vehicles in Household
COMPARE
Immigrants from Belgium
Menominee
2 or more Vehicles in Household
2 or more Vehicles in Household Comparison
Immigrants from Belgium
Menominee
54.3%
2 OR MORE VEHICLES IN HOUSEHOLD
13.7/ 100
METRIC RATING
204th/ 347
METRIC RANK
55.3%
2 OR MORE VEHICLES IN HOUSEHOLD
46.2/ 100
METRIC RATING
177th/ 347
METRIC RANK
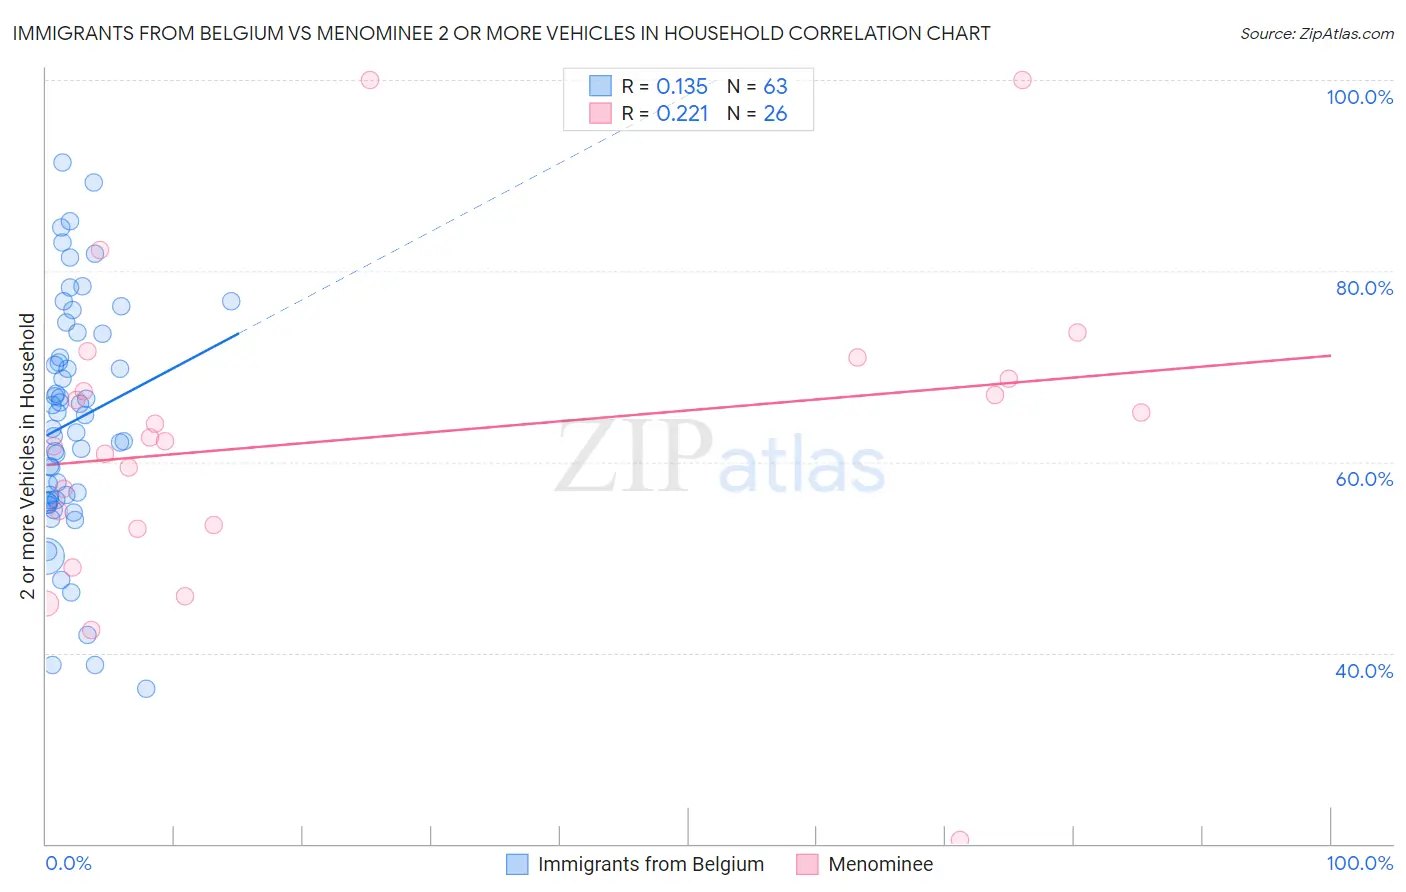
Immigrants from Belgium vs Menominee 2 or more Vehicles in Household Correlation Chart
The statistical analysis conducted on geographies consisting of 146,670,749 people shows a poor positive correlation between the proportion of Immigrants from Belgium and percentage of households with 2 or more vehicles available in the United States with a correlation coefficient (R) of 0.135 and weighted average of 54.3%. Similarly, the statistical analysis conducted on geographies consisting of 45,777,849 people shows a weak positive correlation between the proportion of Menominee and percentage of households with 2 or more vehicles available in the United States with a correlation coefficient (R) of 0.221 and weighted average of 55.3%, a difference of 1.7%.
2 or more Vehicles in Household Correlation Summary
| Measurement | Immigrants from Belgium | Menominee |
| Minimum | 36.2% | 20.4% |
| Maximum | 91.3% | 100.0% |
| Range | 55.1% | 79.6% |
| Mean | 64.2% | 62.5% |
| Median | 63.5% | 62.4% |
| Interquartile 25% (IQ1) | 56.0% | 53.4% |
| Interquartile 75% (IQ3) | 73.5% | 68.7% |
| Interquartile Range (IQR) | 17.4% | 15.3% |
| Standard Deviation (Sample) | 12.3% | 16.5% |
| Standard Deviation (Population) | 12.2% | 16.2% |
Similar Demographics by 2 or more Vehicles in Household
Demographics Similar to Immigrants from Belgium by 2 or more Vehicles in Household
In terms of 2 or more vehicles in household, the demographic groups most similar to Immigrants from Belgium are Cheyenne (54.3%, a difference of 0.010%), Immigrants from Peru (54.4%, a difference of 0.050%), Immigrants from Latin America (54.3%, a difference of 0.060%), Turkish (54.3%, a difference of 0.070%), and Immigrants from North Macedonia (54.4%, a difference of 0.090%).
| Demographics | Rating | Rank | 2 or more Vehicles in Household |
| Argentineans | 17.5 /100 | #197 | Poor 54.5% |
| Carpatho Rusyns | 16.2 /100 | #198 | Poor 54.4% |
| Immigrants | Norway | 15.9 /100 | #199 | Poor 54.4% |
| Houma | 15.8 /100 | #200 | Poor 54.4% |
| Immigrants | Italy | 15.5 /100 | #201 | Poor 54.4% |
| Immigrants | North Macedonia | 14.9 /100 | #202 | Poor 54.4% |
| Immigrants | Peru | 14.3 /100 | #203 | Poor 54.4% |
| Immigrants | Belgium | 13.7 /100 | #204 | Poor 54.3% |
| Cheyenne | 13.6 /100 | #205 | Poor 54.3% |
| Immigrants | Latin America | 13.1 /100 | #206 | Poor 54.3% |
| Turks | 13.0 /100 | #207 | Poor 54.3% |
| Egyptians | 12.0 /100 | #208 | Poor 54.3% |
| Immigrants | Bulgaria | 12.0 /100 | #209 | Poor 54.3% |
| Immigrants | Saudi Arabia | 11.3 /100 | #210 | Poor 54.2% |
| Immigrants | Hungary | 11.3 /100 | #211 | Poor 54.2% |
Demographics Similar to Menominee by 2 or more Vehicles in Household
In terms of 2 or more vehicles in household, the demographic groups most similar to Menominee are Immigrants from Cuba (55.3%, a difference of 0.030%), Immigrants from Sweden (55.2%, a difference of 0.040%), Immigrants from Denmark (55.3%, a difference of 0.13%), Alaskan Athabascan (55.2%, a difference of 0.13%), and Navajo (55.3%, a difference of 0.15%).
| Demographics | Rating | Rank | 2 or more Vehicles in Household |
| Romanians | 55.8 /100 | #170 | Average 55.5% |
| Immigrants | Costa Rica | 54.4 /100 | #171 | Average 55.4% |
| Immigrants | Nicaragua | 51.6 /100 | #172 | Average 55.4% |
| Immigrants | Western Europe | 51.4 /100 | #173 | Average 55.4% |
| Navajo | 50.0 /100 | #174 | Average 55.3% |
| Immigrants | Denmark | 49.4 /100 | #175 | Average 55.3% |
| Immigrants | Cuba | 47.0 /100 | #176 | Average 55.3% |
| Menominee | 46.2 /100 | #177 | Average 55.3% |
| Immigrants | Sweden | 45.3 /100 | #178 | Average 55.2% |
| Alaskan Athabascans | 42.9 /100 | #179 | Average 55.2% |
| Immigrants | Kenya | 40.4 /100 | #180 | Average 55.1% |
| Immigrants | Micronesia | 38.2 /100 | #181 | Fair 55.1% |
| Cree | 38.2 /100 | #182 | Fair 55.1% |
| Immigrants | Cameroon | 37.3 /100 | #183 | Fair 55.1% |
| Apache | 36.7 /100 | #184 | Fair 55.1% |