Immigrants from Belgium vs White/Caucasian 2 or more Vehicles in Household
COMPARE
Immigrants from Belgium
White/Caucasian
2 or more Vehicles in Household
2 or more Vehicles in Household Comparison
Immigrants from Belgium
Whites/Caucasians
54.3%
2 OR MORE VEHICLES IN HOUSEHOLD
13.7/ 100
METRIC RATING
204th/ 347
METRIC RANK
60.8%
2 OR MORE VEHICLES IN HOUSEHOLD
100.0/ 100
METRIC RATING
25th/ 347
METRIC RANK
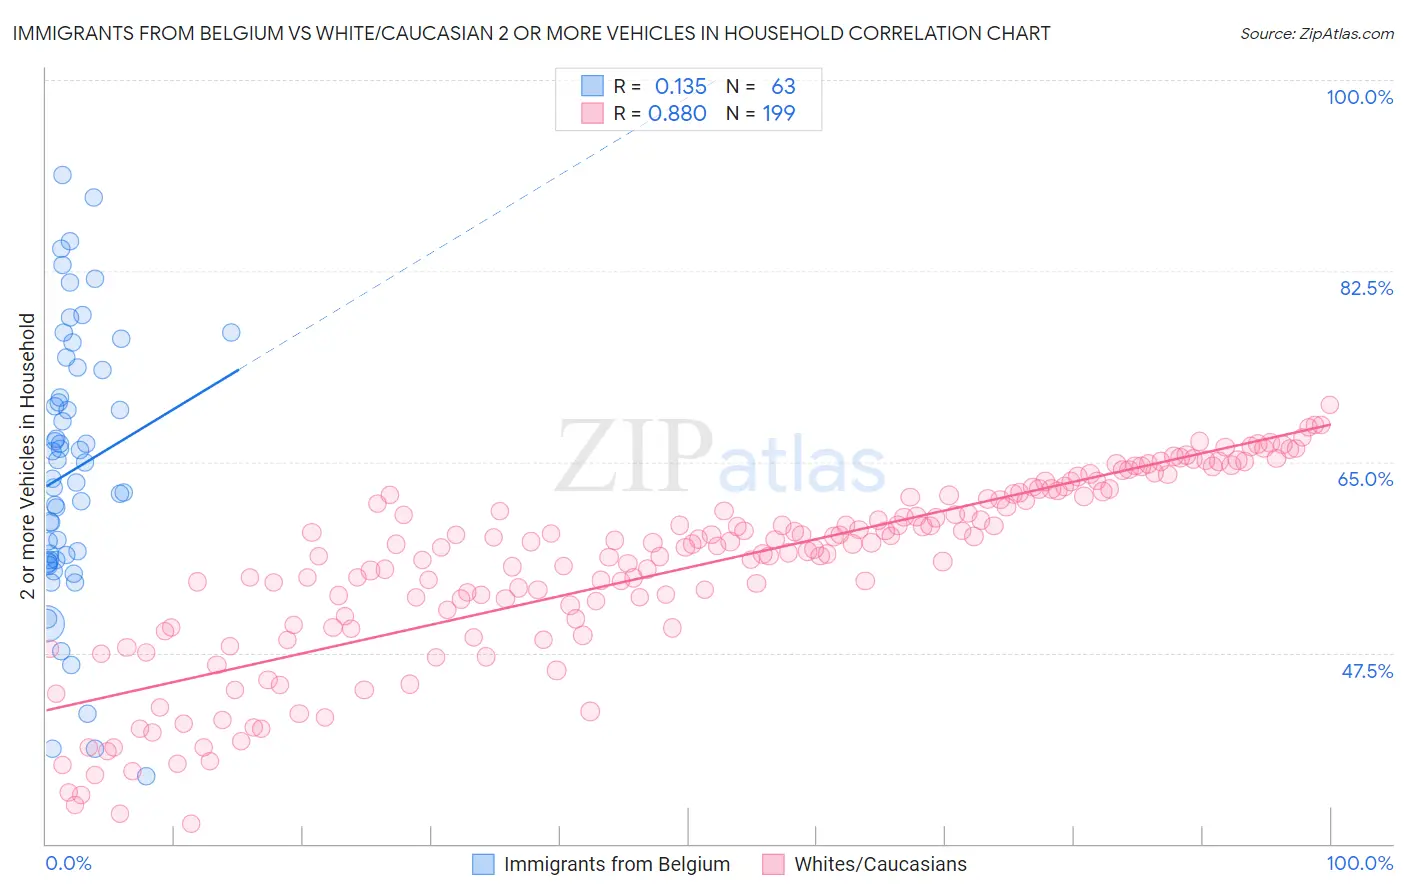
Immigrants from Belgium vs White/Caucasian 2 or more Vehicles in Household Correlation Chart
The statistical analysis conducted on geographies consisting of 146,670,749 people shows a poor positive correlation between the proportion of Immigrants from Belgium and percentage of households with 2 or more vehicles available in the United States with a correlation coefficient (R) of 0.135 and weighted average of 54.3%. Similarly, the statistical analysis conducted on geographies consisting of 571,878,025 people shows a very strong positive correlation between the proportion of Whites/Caucasians and percentage of households with 2 or more vehicles available in the United States with a correlation coefficient (R) of 0.880 and weighted average of 60.8%, a difference of 11.9%.
2 or more Vehicles in Household Correlation Summary
| Measurement | Immigrants from Belgium | White/Caucasian |
| Minimum | 36.2% | 31.8% |
| Maximum | 91.3% | 70.2% |
| Range | 55.1% | 38.4% |
| Mean | 64.2% | 55.3% |
| Median | 63.5% | 57.5% |
| Interquartile 25% (IQ1) | 56.0% | 50.1% |
| Interquartile 75% (IQ3) | 73.5% | 61.9% |
| Interquartile Range (IQR) | 17.4% | 11.8% |
| Standard Deviation (Sample) | 12.3% | 8.6% |
| Standard Deviation (Population) | 12.2% | 8.6% |
Similar Demographics by 2 or more Vehicles in Household
Demographics Similar to Immigrants from Belgium by 2 or more Vehicles in Household
In terms of 2 or more vehicles in household, the demographic groups most similar to Immigrants from Belgium are Cheyenne (54.3%, a difference of 0.010%), Immigrants from Peru (54.4%, a difference of 0.050%), Immigrants from Latin America (54.3%, a difference of 0.060%), Turkish (54.3%, a difference of 0.070%), and Immigrants from North Macedonia (54.4%, a difference of 0.090%).
| Demographics | Rating | Rank | 2 or more Vehicles in Household |
| Argentineans | 17.5 /100 | #197 | Poor 54.5% |
| Carpatho Rusyns | 16.2 /100 | #198 | Poor 54.4% |
| Immigrants | Norway | 15.9 /100 | #199 | Poor 54.4% |
| Houma | 15.8 /100 | #200 | Poor 54.4% |
| Immigrants | Italy | 15.5 /100 | #201 | Poor 54.4% |
| Immigrants | North Macedonia | 14.9 /100 | #202 | Poor 54.4% |
| Immigrants | Peru | 14.3 /100 | #203 | Poor 54.4% |
| Immigrants | Belgium | 13.7 /100 | #204 | Poor 54.3% |
| Cheyenne | 13.6 /100 | #205 | Poor 54.3% |
| Immigrants | Latin America | 13.1 /100 | #206 | Poor 54.3% |
| Turks | 13.0 /100 | #207 | Poor 54.3% |
| Egyptians | 12.0 /100 | #208 | Poor 54.3% |
| Immigrants | Bulgaria | 12.0 /100 | #209 | Poor 54.3% |
| Immigrants | Saudi Arabia | 11.3 /100 | #210 | Poor 54.2% |
| Immigrants | Hungary | 11.3 /100 | #211 | Poor 54.2% |
Demographics Similar to Whites/Caucasians by 2 or more Vehicles in Household
In terms of 2 or more vehicles in household, the demographic groups most similar to Whites/Caucasians are Welsh (60.8%, a difference of 0.050%), Immigrants from Vietnam (60.9%, a difference of 0.15%), Scotch-Irish (60.9%, a difference of 0.19%), Swiss (61.0%, a difference of 0.23%), and Korean (61.0%, a difference of 0.26%).
| Demographics | Rating | Rank | 2 or more Vehicles in Household |
| Europeans | 100.0 /100 | #18 | Exceptional 61.4% |
| Scottish | 100.0 /100 | #19 | Exceptional 61.2% |
| Sri Lankans | 100.0 /100 | #20 | Exceptional 61.0% |
| Koreans | 100.0 /100 | #21 | Exceptional 61.0% |
| Swiss | 100.0 /100 | #22 | Exceptional 61.0% |
| Scotch-Irish | 100.0 /100 | #23 | Exceptional 60.9% |
| Immigrants | Vietnam | 100.0 /100 | #24 | Exceptional 60.9% |
| Whites/Caucasians | 100.0 /100 | #25 | Exceptional 60.8% |
| Welsh | 100.0 /100 | #26 | Exceptional 60.8% |
| Assyrians/Chaldeans/Syriacs | 100.0 /100 | #27 | Exceptional 60.5% |
| Guamanians/Chamorros | 100.0 /100 | #28 | Exceptional 60.5% |
| Hawaiians | 100.0 /100 | #29 | Exceptional 60.4% |
| Finns | 100.0 /100 | #30 | Exceptional 60.3% |
| Spanish American Indians | 100.0 /100 | #31 | Exceptional 60.3% |
| Arapaho | 100.0 /100 | #32 | Exceptional 60.2% |