Immigrants from Belgium vs Panamanian 2 or more Vehicles in Household
COMPARE
Immigrants from Belgium
Panamanian
2 or more Vehicles in Household
2 or more Vehicles in Household Comparison
Immigrants from Belgium
Panamanians
54.3%
2 OR MORE VEHICLES IN HOUSEHOLD
13.7/ 100
METRIC RATING
204th/ 347
METRIC RANK
53.5%
2 OR MORE VEHICLES IN HOUSEHOLD
3.4/ 100
METRIC RATING
231st/ 347
METRIC RANK
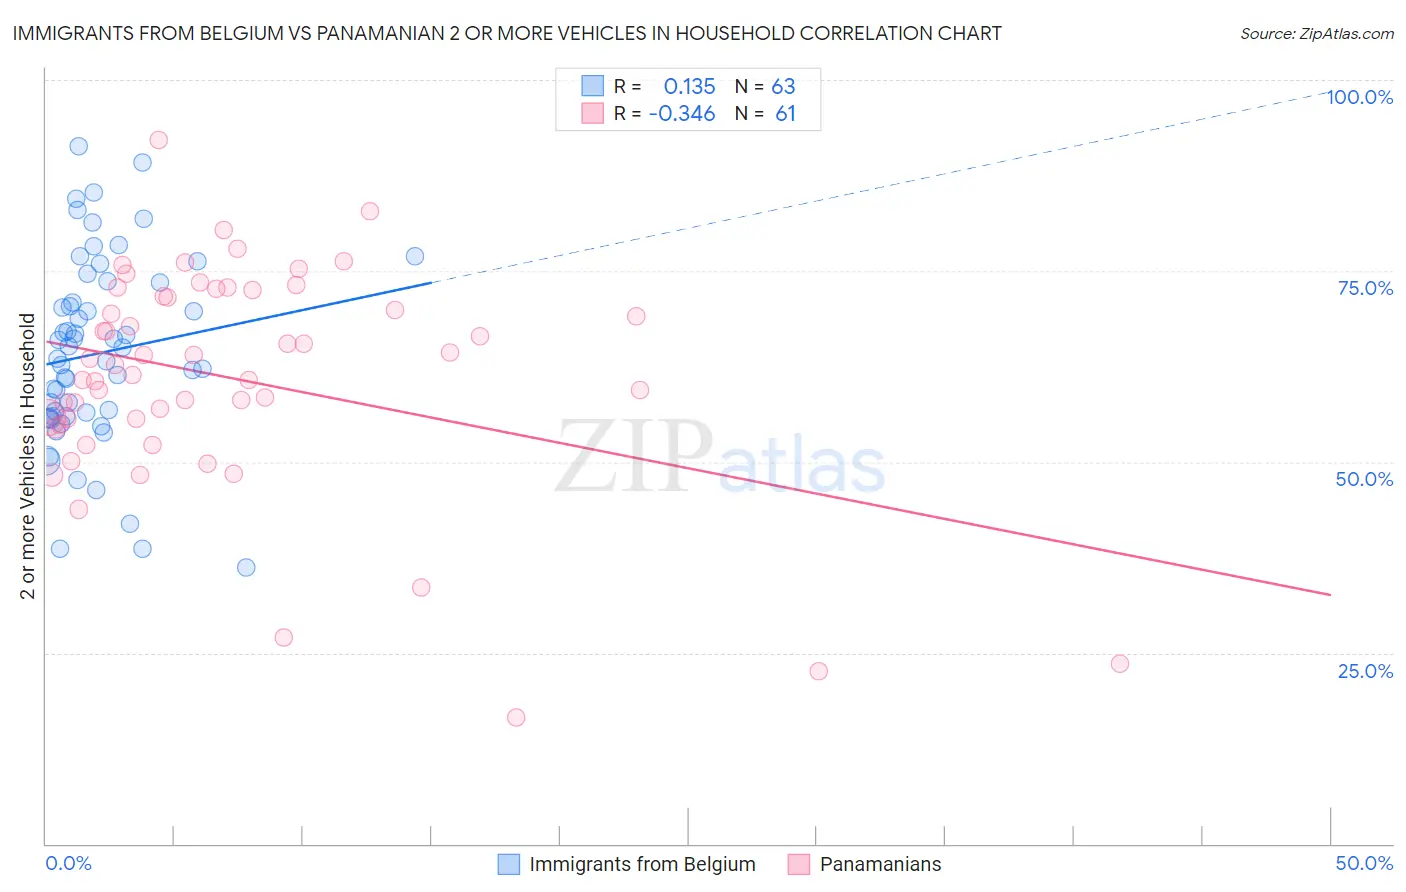
Immigrants from Belgium vs Panamanian 2 or more Vehicles in Household Correlation Chart
The statistical analysis conducted on geographies consisting of 146,670,749 people shows a poor positive correlation between the proportion of Immigrants from Belgium and percentage of households with 2 or more vehicles available in the United States with a correlation coefficient (R) of 0.135 and weighted average of 54.3%. Similarly, the statistical analysis conducted on geographies consisting of 281,077,376 people shows a mild negative correlation between the proportion of Panamanians and percentage of households with 2 or more vehicles available in the United States with a correlation coefficient (R) of -0.346 and weighted average of 53.5%, a difference of 1.5%.
2 or more Vehicles in Household Correlation Summary
| Measurement | Immigrants from Belgium | Panamanian |
| Minimum | 36.2% | 16.5% |
| Maximum | 91.3% | 92.2% |
| Range | 55.1% | 75.7% |
| Mean | 64.2% | 61.0% |
| Median | 63.5% | 62.7% |
| Interquartile 25% (IQ1) | 56.0% | 55.3% |
| Interquartile 75% (IQ3) | 73.5% | 72.1% |
| Interquartile Range (IQR) | 17.4% | 16.8% |
| Standard Deviation (Sample) | 12.3% | 14.6% |
| Standard Deviation (Population) | 12.2% | 14.5% |
Similar Demographics by 2 or more Vehicles in Household
Demographics Similar to Immigrants from Belgium by 2 or more Vehicles in Household
In terms of 2 or more vehicles in household, the demographic groups most similar to Immigrants from Belgium are Cheyenne (54.3%, a difference of 0.010%), Immigrants from Peru (54.4%, a difference of 0.050%), Immigrants from Latin America (54.3%, a difference of 0.060%), Turkish (54.3%, a difference of 0.070%), and Immigrants from North Macedonia (54.4%, a difference of 0.090%).
| Demographics | Rating | Rank | 2 or more Vehicles in Household |
| Argentineans | 17.5 /100 | #197 | Poor 54.5% |
| Carpatho Rusyns | 16.2 /100 | #198 | Poor 54.4% |
| Immigrants | Norway | 15.9 /100 | #199 | Poor 54.4% |
| Houma | 15.8 /100 | #200 | Poor 54.4% |
| Immigrants | Italy | 15.5 /100 | #201 | Poor 54.4% |
| Immigrants | North Macedonia | 14.9 /100 | #202 | Poor 54.4% |
| Immigrants | Peru | 14.3 /100 | #203 | Poor 54.4% |
| Immigrants | Belgium | 13.7 /100 | #204 | Poor 54.3% |
| Cheyenne | 13.6 /100 | #205 | Poor 54.3% |
| Immigrants | Latin America | 13.1 /100 | #206 | Poor 54.3% |
| Turks | 13.0 /100 | #207 | Poor 54.3% |
| Egyptians | 12.0 /100 | #208 | Poor 54.3% |
| Immigrants | Bulgaria | 12.0 /100 | #209 | Poor 54.3% |
| Immigrants | Saudi Arabia | 11.3 /100 | #210 | Poor 54.2% |
| Immigrants | Hungary | 11.3 /100 | #211 | Poor 54.2% |
Demographics Similar to Panamanians by 2 or more Vehicles in Household
In terms of 2 or more vehicles in household, the demographic groups most similar to Panamanians are Immigrants from Nepal (53.5%, a difference of 0.050%), Immigrants from Guatemala (53.5%, a difference of 0.070%), Ugandan (53.5%, a difference of 0.080%), Immigrants from Turkey (53.6%, a difference of 0.11%), and Alaska Native (53.6%, a difference of 0.13%).
| Demographics | Rating | Rank | 2 or more Vehicles in Household |
| Brazilians | 5.3 /100 | #224 | Tragic 53.8% |
| Immigrants | Egypt | 5.2 /100 | #225 | Tragic 53.8% |
| Immigrants | Eastern Africa | 5.1 /100 | #226 | Tragic 53.7% |
| Sudanese | 4.1 /100 | #227 | Tragic 53.6% |
| Alaska Natives | 3.9 /100 | #228 | Tragic 53.6% |
| Immigrants | Turkey | 3.8 /100 | #229 | Tragic 53.6% |
| Immigrants | Nepal | 3.6 /100 | #230 | Tragic 53.5% |
| Panamanians | 3.4 /100 | #231 | Tragic 53.5% |
| Immigrants | Guatemala | 3.2 /100 | #232 | Tragic 53.5% |
| Ugandans | 3.2 /100 | #233 | Tragic 53.5% |
| Immigrants | Switzerland | 3.0 /100 | #234 | Tragic 53.4% |
| Immigrants | Middle Africa | 3.0 /100 | #235 | Tragic 53.4% |
| Indonesians | 2.7 /100 | #236 | Tragic 53.4% |
| Macedonians | 2.4 /100 | #237 | Tragic 53.3% |
| Immigrants | Armenia | 2.3 /100 | #238 | Tragic 53.3% |