Immigrants from Belgium vs Immigrants from Moldova High School Diploma
COMPARE
Immigrants from Belgium
Immigrants from Moldova
High School Diploma
High School Diploma Comparison
Immigrants from Belgium
Immigrants from Moldova
91.1%
HIGH SCHOOL DIPLOMA
99.7/ 100
METRIC RATING
53rd/ 347
METRIC RANK
90.7%
HIGH SCHOOL DIPLOMA
99.2/ 100
METRIC RATING
83rd/ 347
METRIC RANK
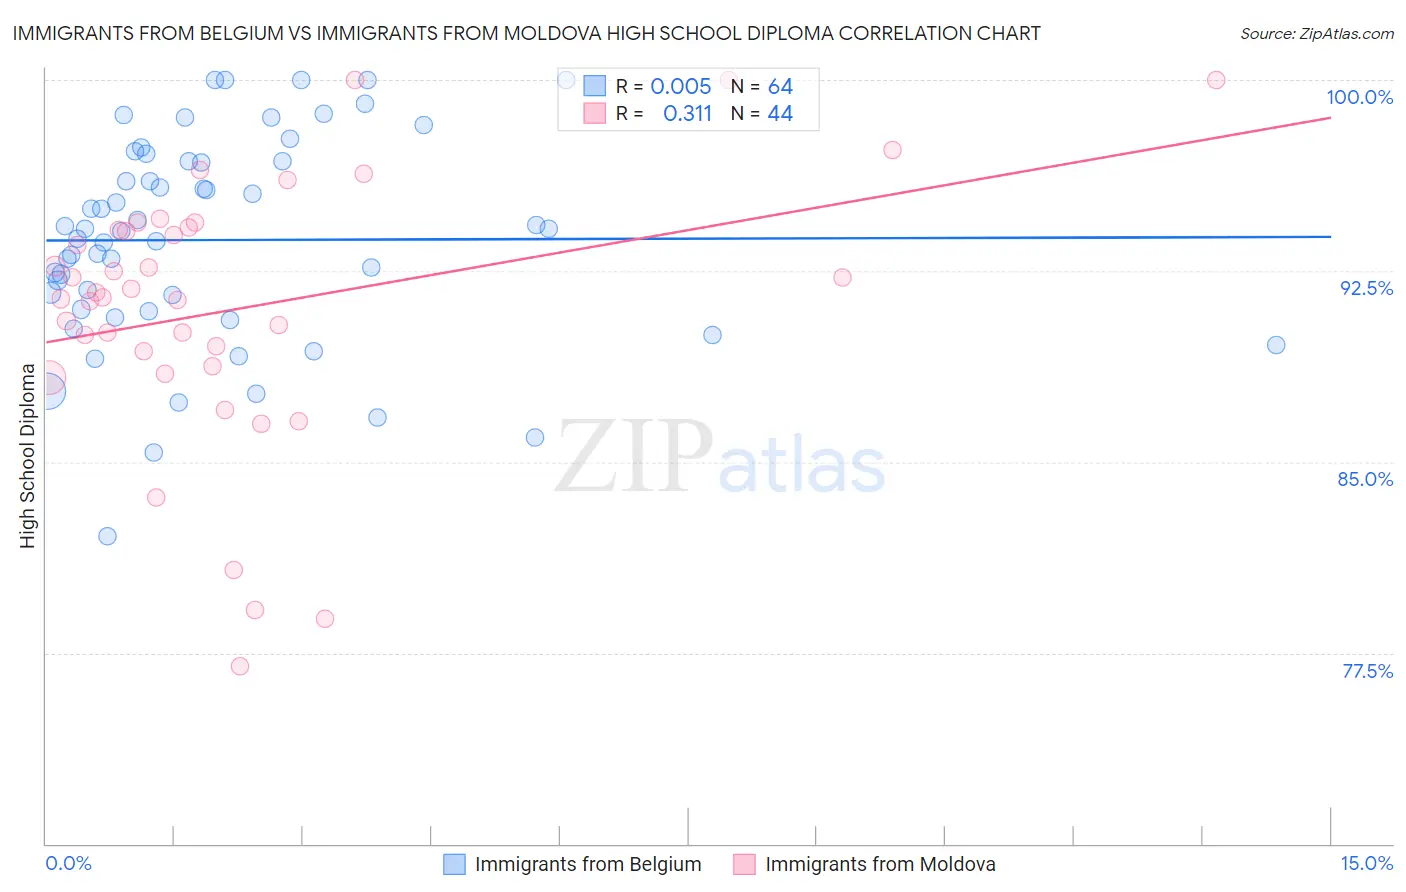
Immigrants from Belgium vs Immigrants from Moldova High School Diploma Correlation Chart
The statistical analysis conducted on geographies consisting of 146,727,159 people shows no correlation between the proportion of Immigrants from Belgium and percentage of population with at least high school diploma education in the United States with a correlation coefficient (R) of 0.005 and weighted average of 91.1%. Similarly, the statistical analysis conducted on geographies consisting of 124,401,069 people shows a mild positive correlation between the proportion of Immigrants from Moldova and percentage of population with at least high school diploma education in the United States with a correlation coefficient (R) of 0.311 and weighted average of 90.7%, a difference of 0.42%.
High School Diploma Correlation Summary
| Measurement | Immigrants from Belgium | Immigrants from Moldova |
| Minimum | 82.1% | 77.0% |
| Maximum | 100.0% | 100.0% |
| Range | 17.9% | 23.0% |
| Mean | 93.7% | 91.0% |
| Median | 94.1% | 91.6% |
| Interquartile 25% (IQ1) | 91.0% | 89.0% |
| Interquartile 75% (IQ3) | 96.8% | 94.2% |
| Interquartile Range (IQR) | 5.8% | 5.1% |
| Standard Deviation (Sample) | 4.1% | 5.3% |
| Standard Deviation (Population) | 4.0% | 5.2% |
Similar Demographics by High School Diploma
Demographics Similar to Immigrants from Belgium by High School Diploma
In terms of high school diploma, the demographic groups most similar to Immigrants from Belgium are New Zealander (91.1%, a difference of 0.0%), Immigrants from Sweden (91.1%, a difference of 0.0%), Macedonian (91.1%, a difference of 0.020%), Serbian (91.1%, a difference of 0.030%), and Welsh (91.2%, a difference of 0.050%).
| Demographics | Rating | Rank | High School Diploma |
| Greeks | 99.8 /100 | #46 | Exceptional 91.2% |
| Australians | 99.8 /100 | #47 | Exceptional 91.2% |
| Belgians | 99.8 /100 | #48 | Exceptional 91.2% |
| Bhutanese | 99.8 /100 | #49 | Exceptional 91.2% |
| Welsh | 99.8 /100 | #50 | Exceptional 91.2% |
| New Zealanders | 99.7 /100 | #51 | Exceptional 91.1% |
| Immigrants | Sweden | 99.7 /100 | #52 | Exceptional 91.1% |
| Immigrants | Belgium | 99.7 /100 | #53 | Exceptional 91.1% |
| Macedonians | 99.7 /100 | #54 | Exceptional 91.1% |
| Serbians | 99.7 /100 | #55 | Exceptional 91.1% |
| Immigrants | Canada | 99.7 /100 | #56 | Exceptional 91.1% |
| Zimbabweans | 99.7 /100 | #57 | Exceptional 91.1% |
| Slavs | 99.7 /100 | #58 | Exceptional 91.0% |
| Immigrants | North America | 99.7 /100 | #59 | Exceptional 91.0% |
| Immigrants | Japan | 99.6 /100 | #60 | Exceptional 91.0% |
Demographics Similar to Immigrants from Moldova by High School Diploma
In terms of high school diploma, the demographic groups most similar to Immigrants from Moldova are Scotch-Irish (90.8%, a difference of 0.020%), Immigrants from Saudi Arabia (90.7%, a difference of 0.030%), Immigrants from Switzerland (90.8%, a difference of 0.050%), Immigrants from England (90.8%, a difference of 0.060%), and Immigrants from Denmark (90.8%, a difference of 0.070%).
| Demographics | Rating | Rank | High School Diploma |
| Hungarians | 99.3 /100 | #76 | Exceptional 90.8% |
| Native Hawaiians | 99.3 /100 | #77 | Exceptional 90.8% |
| Burmese | 99.3 /100 | #78 | Exceptional 90.8% |
| Immigrants | Denmark | 99.3 /100 | #79 | Exceptional 90.8% |
| Immigrants | England | 99.3 /100 | #80 | Exceptional 90.8% |
| Immigrants | Switzerland | 99.3 /100 | #81 | Exceptional 90.8% |
| Scotch-Irish | 99.2 /100 | #82 | Exceptional 90.8% |
| Immigrants | Moldova | 99.2 /100 | #83 | Exceptional 90.7% |
| Immigrants | Saudi Arabia | 99.1 /100 | #84 | Exceptional 90.7% |
| Romanians | 98.9 /100 | #85 | Exceptional 90.7% |
| Immigrants | Bulgaria | 98.9 /100 | #86 | Exceptional 90.6% |
| Immigrants | Turkey | 98.9 /100 | #87 | Exceptional 90.6% |
| Immigrants | France | 98.8 /100 | #88 | Exceptional 90.6% |
| Canadians | 98.7 /100 | #89 | Exceptional 90.6% |
| Celtics | 98.7 /100 | #90 | Exceptional 90.6% |