Immigrants from Belgium vs Immigrants from Moldova GED/Equivalency
COMPARE
Immigrants from Belgium
Immigrants from Moldova
GED/Equivalency
GED/Equivalency Comparison
Immigrants from Belgium
Immigrants from Moldova
88.3%
GED/EQUIVALENCY
99.7/ 100
METRIC RATING
36th/ 347
METRIC RANK
87.7%
GED/EQUIVALENCY
98.8/ 100
METRIC RATING
72nd/ 347
METRIC RANK
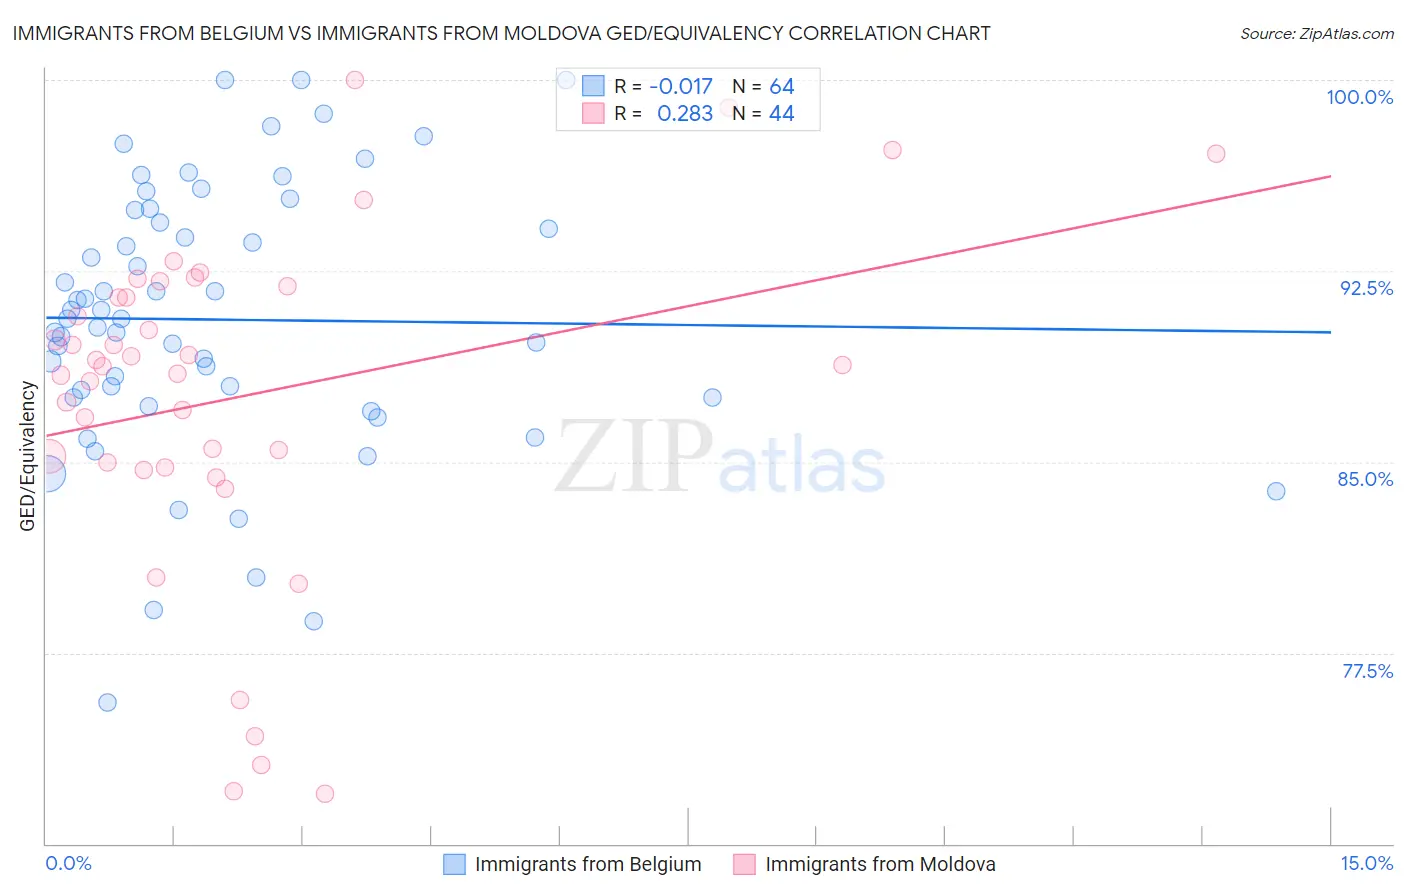
Immigrants from Belgium vs Immigrants from Moldova GED/Equivalency Correlation Chart
The statistical analysis conducted on geographies consisting of 146,727,159 people shows no correlation between the proportion of Immigrants from Belgium and percentage of population with at least ged/equivalency education in the United States with a correlation coefficient (R) of -0.017 and weighted average of 88.3%. Similarly, the statistical analysis conducted on geographies consisting of 124,401,069 people shows a weak positive correlation between the proportion of Immigrants from Moldova and percentage of population with at least ged/equivalency education in the United States with a correlation coefficient (R) of 0.283 and weighted average of 87.7%, a difference of 0.73%.
GED/Equivalency Correlation Summary
| Measurement | Immigrants from Belgium | Immigrants from Moldova |
| Minimum | 75.5% | 72.0% |
| Maximum | 100.0% | 100.0% |
| Range | 24.5% | 28.0% |
| Mean | 90.6% | 87.6% |
| Median | 90.6% | 88.8% |
| Interquartile 25% (IQ1) | 87.5% | 84.9% |
| Interquartile 75% (IQ3) | 94.6% | 91.7% |
| Interquartile Range (IQR) | 7.1% | 6.8% |
| Standard Deviation (Sample) | 5.4% | 6.7% |
| Standard Deviation (Population) | 5.3% | 6.6% |
Similar Demographics by GED/Equivalency
Demographics Similar to Immigrants from Belgium by GED/Equivalency
In terms of ged/equivalency, the demographic groups most similar to Immigrants from Belgium are Immigrants from South Central Asia (88.4%, a difference of 0.020%), Immigrants from Austria (88.3%, a difference of 0.030%), Immigrants from Japan (88.4%, a difference of 0.040%), Immigrants from Sweden (88.4%, a difference of 0.050%), and Burmese (88.3%, a difference of 0.060%).
| Demographics | Rating | Rank | GED/Equivalency |
| Poles | 99.8 /100 | #29 | Exceptional 88.5% |
| Turks | 99.8 /100 | #30 | Exceptional 88.5% |
| Bhutanese | 99.8 /100 | #31 | Exceptional 88.4% |
| Danes | 99.8 /100 | #32 | Exceptional 88.4% |
| Immigrants | Sweden | 99.7 /100 | #33 | Exceptional 88.4% |
| Immigrants | Japan | 99.7 /100 | #34 | Exceptional 88.4% |
| Immigrants | South Central Asia | 99.7 /100 | #35 | Exceptional 88.4% |
| Immigrants | Belgium | 99.7 /100 | #36 | Exceptional 88.3% |
| Immigrants | Austria | 99.7 /100 | #37 | Exceptional 88.3% |
| Burmese | 99.7 /100 | #38 | Exceptional 88.3% |
| Immigrants | Israel | 99.6 /100 | #39 | Exceptional 88.2% |
| Italians | 99.6 /100 | #40 | Exceptional 88.2% |
| Finns | 99.6 /100 | #41 | Exceptional 88.2% |
| Cambodians | 99.6 /100 | #42 | Exceptional 88.2% |
| Immigrants | Scotland | 99.6 /100 | #43 | Exceptional 88.2% |
Demographics Similar to Immigrants from Moldova by GED/Equivalency
In terms of ged/equivalency, the demographic groups most similar to Immigrants from Moldova are Ukrainian (87.7%, a difference of 0.0%), Austrian (87.7%, a difference of 0.0%), Belgian (87.7%, a difference of 0.010%), Immigrants from Kuwait (87.7%, a difference of 0.030%), and Immigrants from Saudi Arabia (87.8%, a difference of 0.050%).
| Demographics | Rating | Rank | GED/Equivalency |
| Immigrants | North America | 99.1 /100 | #65 | Exceptional 87.8% |
| Immigrants | Bulgaria | 99.1 /100 | #66 | Exceptional 87.8% |
| British | 99.1 /100 | #67 | Exceptional 87.8% |
| Immigrants | France | 99.1 /100 | #68 | Exceptional 87.8% |
| Immigrants | Saudi Arabia | 99.0 /100 | #69 | Exceptional 87.8% |
| Ukrainians | 98.8 /100 | #70 | Exceptional 87.7% |
| Austrians | 98.8 /100 | #71 | Exceptional 87.7% |
| Immigrants | Moldova | 98.8 /100 | #72 | Exceptional 87.7% |
| Belgians | 98.8 /100 | #73 | Exceptional 87.7% |
| Immigrants | Kuwait | 98.8 /100 | #74 | Exceptional 87.7% |
| Scottish | 98.7 /100 | #75 | Exceptional 87.7% |
| Immigrants | Serbia | 98.7 /100 | #76 | Exceptional 87.7% |
| Slavs | 98.7 /100 | #77 | Exceptional 87.7% |
| Irish | 98.6 /100 | #78 | Exceptional 87.6% |
| English | 98.6 /100 | #79 | Exceptional 87.6% |