Immigrants from Guyana vs Immigrants from Moldova 2 or more Vehicles in Household
COMPARE
Immigrants from Guyana
Immigrants from Moldova
2 or more Vehicles in Household
2 or more Vehicles in Household Comparison
Immigrants from Guyana
Immigrants from Moldova
35.0%
2 OR MORE VEHICLES IN HOUSEHOLD
0.0/ 100
METRIC RATING
343rd/ 347
METRIC RANK
56.1%
2 OR MORE VEHICLES IN HOUSEHOLD
80.2/ 100
METRIC RATING
148th/ 347
METRIC RANK
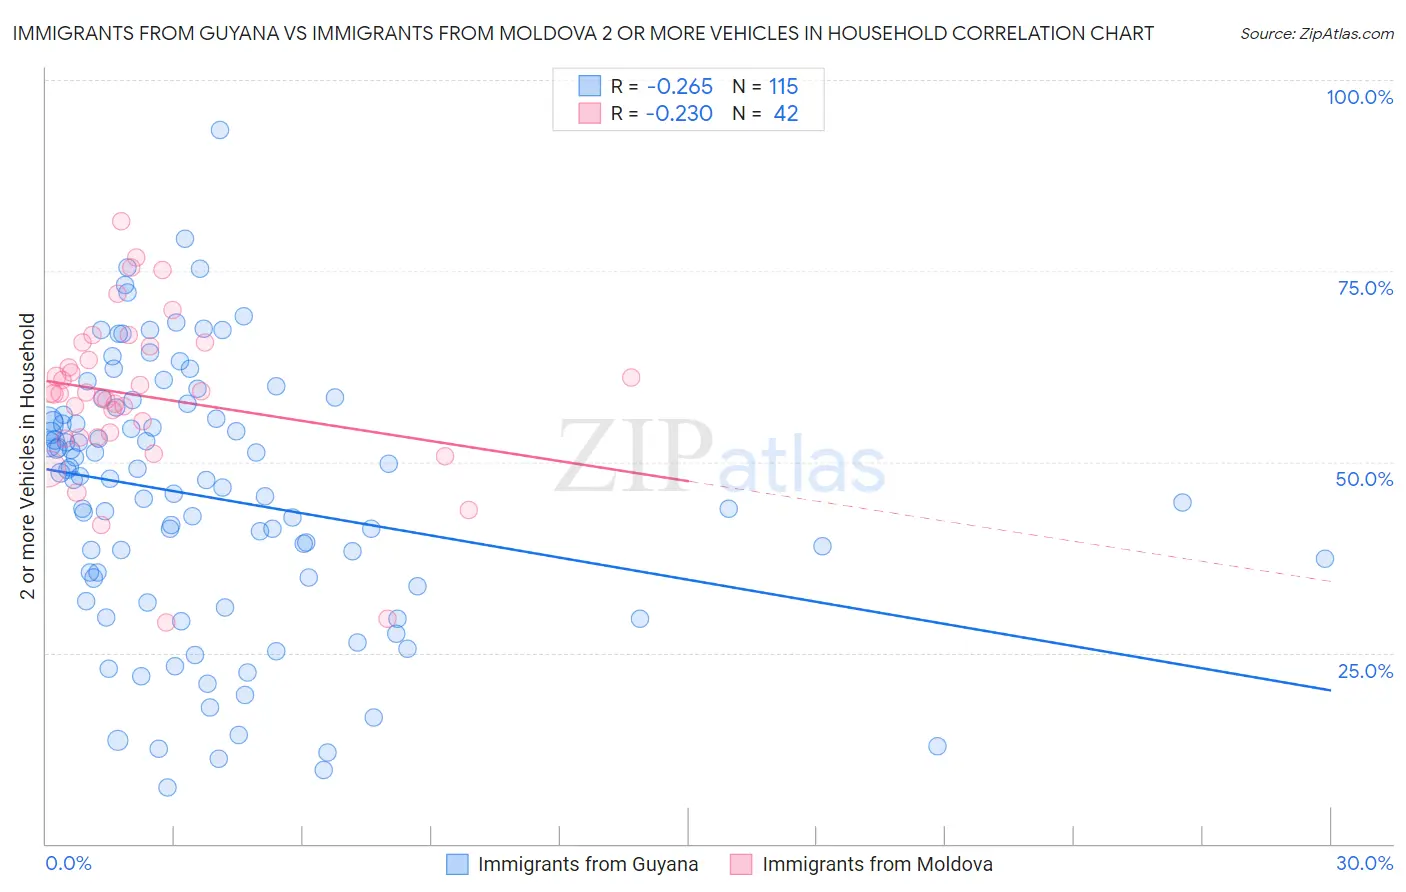
Immigrants from Guyana vs Immigrants from Moldova 2 or more Vehicles in Household Correlation Chart
The statistical analysis conducted on geographies consisting of 183,691,149 people shows a weak negative correlation between the proportion of Immigrants from Guyana and percentage of households with 2 or more vehicles available in the United States with a correlation coefficient (R) of -0.265 and weighted average of 35.0%. Similarly, the statistical analysis conducted on geographies consisting of 124,285,245 people shows a weak negative correlation between the proportion of Immigrants from Moldova and percentage of households with 2 or more vehicles available in the United States with a correlation coefficient (R) of -0.230 and weighted average of 56.1%, a difference of 60.3%.
2 or more Vehicles in Household Correlation Summary
| Measurement | Immigrants from Guyana | Immigrants from Moldova |
| Minimum | 7.4% | 29.0% |
| Maximum | 93.5% | 81.6% |
| Range | 86.1% | 52.5% |
| Mean | 45.2% | 58.6% |
| Median | 47.6% | 59.0% |
| Interquartile 25% (IQ1) | 33.7% | 53.2% |
| Interquartile 75% (IQ3) | 56.2% | 65.1% |
| Interquartile Range (IQR) | 22.5% | 11.9% |
| Standard Deviation (Sample) | 17.3% | 10.8% |
| Standard Deviation (Population) | 17.2% | 10.7% |
Similar Demographics by 2 or more Vehicles in Household
Demographics Similar to Immigrants from Guyana by 2 or more Vehicles in Household
In terms of 2 or more vehicles in household, the demographic groups most similar to Immigrants from Guyana are Yup'ik (34.9%, a difference of 0.17%), Dominican (35.3%, a difference of 0.89%), Guyanese (35.4%, a difference of 1.1%), British West Indian (35.4%, a difference of 1.1%), and Immigrants from Barbados (35.8%, a difference of 2.2%).
| Demographics | Rating | Rank | 2 or more Vehicles in Household |
| Immigrants | Ecuador | 0.0 /100 | #333 | Tragic 40.5% |
| Immigrants | Trinidad and Tobago | 0.0 /100 | #334 | Tragic 40.3% |
| Immigrants | Bangladesh | 0.0 /100 | #335 | Tragic 38.8% |
| Vietnamese | 0.0 /100 | #336 | Tragic 38.5% |
| Barbadians | 0.0 /100 | #337 | Tragic 38.3% |
| Immigrants | Uzbekistan | 0.0 /100 | #338 | Tragic 37.9% |
| Immigrants | Barbados | 0.0 /100 | #339 | Tragic 35.8% |
| British West Indians | 0.0 /100 | #340 | Tragic 35.4% |
| Guyanese | 0.0 /100 | #341 | Tragic 35.4% |
| Dominicans | 0.0 /100 | #342 | Tragic 35.3% |
| Immigrants | Guyana | 0.0 /100 | #343 | Tragic 35.0% |
| Yup'ik | 0.0 /100 | #344 | Tragic 34.9% |
| Immigrants | Dominican Republic | 0.0 /100 | #345 | Tragic 33.2% |
| Immigrants | St. Vincent and the Grenadines | 0.0 /100 | #346 | Tragic 31.0% |
| Immigrants | Grenada | 0.0 /100 | #347 | Tragic 28.7% |
Demographics Similar to Immigrants from Moldova by 2 or more Vehicles in Household
In terms of 2 or more vehicles in household, the demographic groups most similar to Immigrants from Moldova are Serbian (56.1%, a difference of 0.0%), Chilean (56.1%, a difference of 0.0%), Nicaraguan (56.1%, a difference of 0.020%), Venezuelan (56.1%, a difference of 0.030%), and Syrian (56.2%, a difference of 0.060%).
| Demographics | Rating | Rank | 2 or more Vehicles in Household |
| Immigrants | Cambodia | 83.6 /100 | #141 | Excellent 56.2% |
| South Africans | 83.1 /100 | #142 | Excellent 56.2% |
| Seminole | 81.7 /100 | #143 | Excellent 56.2% |
| Immigrants | Syria | 81.4 /100 | #144 | Excellent 56.2% |
| Syrians | 81.2 /100 | #145 | Excellent 56.2% |
| Venezuelans | 80.7 /100 | #146 | Excellent 56.1% |
| Serbians | 80.3 /100 | #147 | Excellent 56.1% |
| Immigrants | Moldova | 80.2 /100 | #148 | Excellent 56.1% |
| Chileans | 80.2 /100 | #149 | Excellent 56.1% |
| Nicaraguans | 79.9 /100 | #150 | Good 56.1% |
| Immigrants | Northern Europe | 78.7 /100 | #151 | Good 56.1% |
| Immigrants | Pakistan | 78.1 /100 | #152 | Good 56.1% |
| Lumbee | 71.9 /100 | #153 | Good 55.9% |
| Ukrainians | 70.8 /100 | #154 | Good 55.8% |
| Immigrants | Venezuela | 70.7 /100 | #155 | Good 55.8% |