Ecuadorian vs Salvadoran 3 or more Vehicles in Household
COMPARE
Ecuadorian
Salvadoran
3 or more Vehicles in Household
3 or more Vehicles in Household Comparison
Ecuadorians
Salvadorans
14.1%
3 OR MORE VEHICLES IN HOUSEHOLD
0.0/ 100
METRIC RATING
327th/ 347
METRIC RANK
21.8%
3 OR MORE VEHICLES IN HOUSEHOLD
99.8/ 100
METRIC RATING
73rd/ 347
METRIC RANK
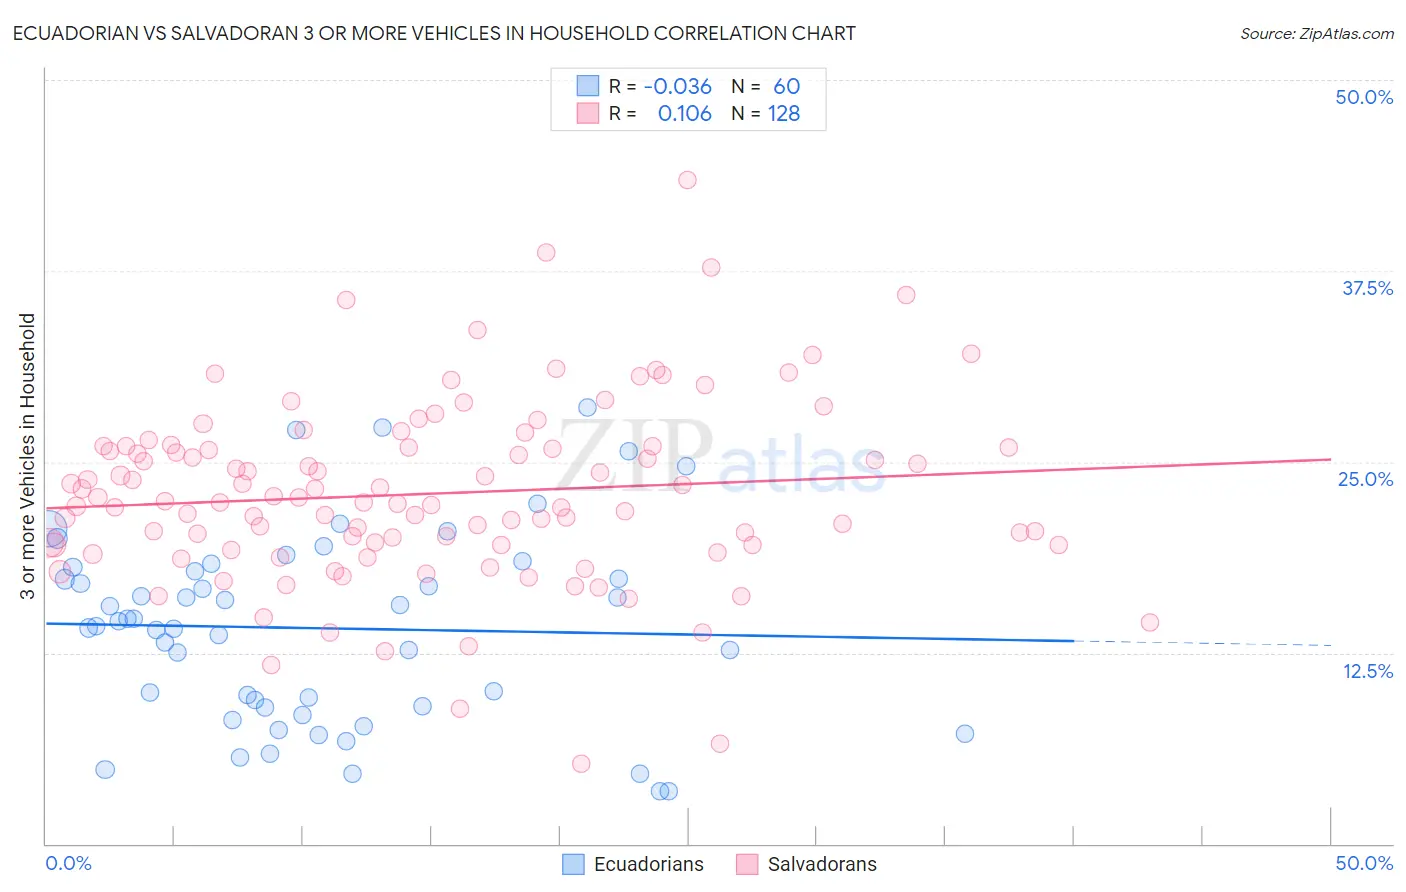
Ecuadorian vs Salvadoran 3 or more Vehicles in Household Correlation Chart
The statistical analysis conducted on geographies consisting of 317,505,117 people shows no correlation between the proportion of Ecuadorians and percentage of households with 3 or more vehicles available in the United States with a correlation coefficient (R) of -0.036 and weighted average of 14.1%. Similarly, the statistical analysis conducted on geographies consisting of 398,656,904 people shows a poor positive correlation between the proportion of Salvadorans and percentage of households with 3 or more vehicles available in the United States with a correlation coefficient (R) of 0.106 and weighted average of 21.8%, a difference of 55.2%.
3 or more Vehicles in Household Correlation Summary
| Measurement | Ecuadorian | Salvadoran |
| Minimum | 3.4% | 5.3% |
| Maximum | 28.5% | 43.4% |
| Range | 25.1% | 38.2% |
| Mean | 14.1% | 22.9% |
| Median | 14.4% | 22.4% |
| Interquartile 25% (IQ1) | 8.9% | 19.6% |
| Interquartile 75% (IQ3) | 18.0% | 26.0% |
| Interquartile Range (IQR) | 9.1% | 6.4% |
| Standard Deviation (Sample) | 6.3% | 6.0% |
| Standard Deviation (Population) | 6.2% | 6.0% |
Similar Demographics by 3 or more Vehicles in Household
Demographics Similar to Ecuadorians by 3 or more Vehicles in Household
In terms of 3 or more vehicles in household, the demographic groups most similar to Ecuadorians are Immigrants from Albania (14.0%, a difference of 0.71%), Soviet Union (14.2%, a difference of 0.89%), Senegalese (14.2%, a difference of 1.2%), Immigrants from Yemen (14.2%, a difference of 1.3%), and Immigrants from Senegal (13.8%, a difference of 1.9%).
| Demographics | Rating | Rank | 3 or more Vehicles in Household |
| Yup'ik | 0.0 /100 | #320 | Tragic 14.8% |
| Immigrants | Jamaica | 0.0 /100 | #321 | Tragic 14.7% |
| Immigrants | West Indies | 0.0 /100 | #322 | Tragic 14.6% |
| Immigrants | Caribbean | 0.0 /100 | #323 | Tragic 14.6% |
| Immigrants | Yemen | 0.0 /100 | #324 | Tragic 14.2% |
| Senegalese | 0.0 /100 | #325 | Tragic 14.2% |
| Soviet Union | 0.0 /100 | #326 | Tragic 14.2% |
| Ecuadorians | 0.0 /100 | #327 | Tragic 14.1% |
| Immigrants | Albania | 0.0 /100 | #328 | Tragic 14.0% |
| Immigrants | Senegal | 0.0 /100 | #329 | Tragic 13.8% |
| West Indians | 0.0 /100 | #330 | Tragic 13.7% |
| Immigrants | Dominica | 0.0 /100 | #331 | Tragic 13.7% |
| Trinidadians and Tobagonians | 0.0 /100 | #332 | Tragic 13.6% |
| Immigrants | Cabo Verde | 0.0 /100 | #333 | Tragic 13.6% |
| Immigrants | Ecuador | 0.0 /100 | #334 | Tragic 13.4% |
Demographics Similar to Salvadorans by 3 or more Vehicles in Household
In terms of 3 or more vehicles in household, the demographic groups most similar to Salvadorans are Immigrants from Oceania (21.8%, a difference of 0.020%), Portuguese (21.8%, a difference of 0.090%), Japanese (21.8%, a difference of 0.12%), Nonimmigrants (21.8%, a difference of 0.16%), and Irish (21.8%, a difference of 0.24%).
| Demographics | Rating | Rank | 3 or more Vehicles in Household |
| Northern Europeans | 99.9 /100 | #66 | Exceptional 22.0% |
| Alaskan Athabascans | 99.9 /100 | #67 | Exceptional 21.9% |
| British | 99.9 /100 | #68 | Exceptional 21.9% |
| Creek | 99.9 /100 | #69 | Exceptional 21.9% |
| Bangladeshis | 99.8 /100 | #70 | Exceptional 21.9% |
| Potawatomi | 99.8 /100 | #71 | Exceptional 21.9% |
| Portuguese | 99.8 /100 | #72 | Exceptional 21.8% |
| Salvadorans | 99.8 /100 | #73 | Exceptional 21.8% |
| Immigrants | Oceania | 99.8 /100 | #74 | Exceptional 21.8% |
| Japanese | 99.8 /100 | #75 | Exceptional 21.8% |
| Immigrants | Nonimmigrants | 99.8 /100 | #76 | Exceptional 21.8% |
| Irish | 99.8 /100 | #77 | Exceptional 21.8% |
| Czechoslovakians | 99.8 /100 | #78 | Exceptional 21.7% |
| Assyrians/Chaldeans/Syriacs | 99.8 /100 | #79 | Exceptional 21.7% |
| Afghans | 99.7 /100 | #80 | Exceptional 21.7% |