Bahamian vs Immigrants from Guatemala 3 or more Vehicles in Household
COMPARE
Bahamian
Immigrants from Guatemala
3 or more Vehicles in Household
3 or more Vehicles in Household Comparison
Bahamians
Immigrants from Guatemala
16.9%
3 OR MORE VEHICLES IN HOUSEHOLD
0.1/ 100
METRIC RATING
293rd/ 347
METRIC RANK
19.7%
3 OR MORE VEHICLES IN HOUSEHOLD
65.6/ 100
METRIC RATING
161st/ 347
METRIC RANK
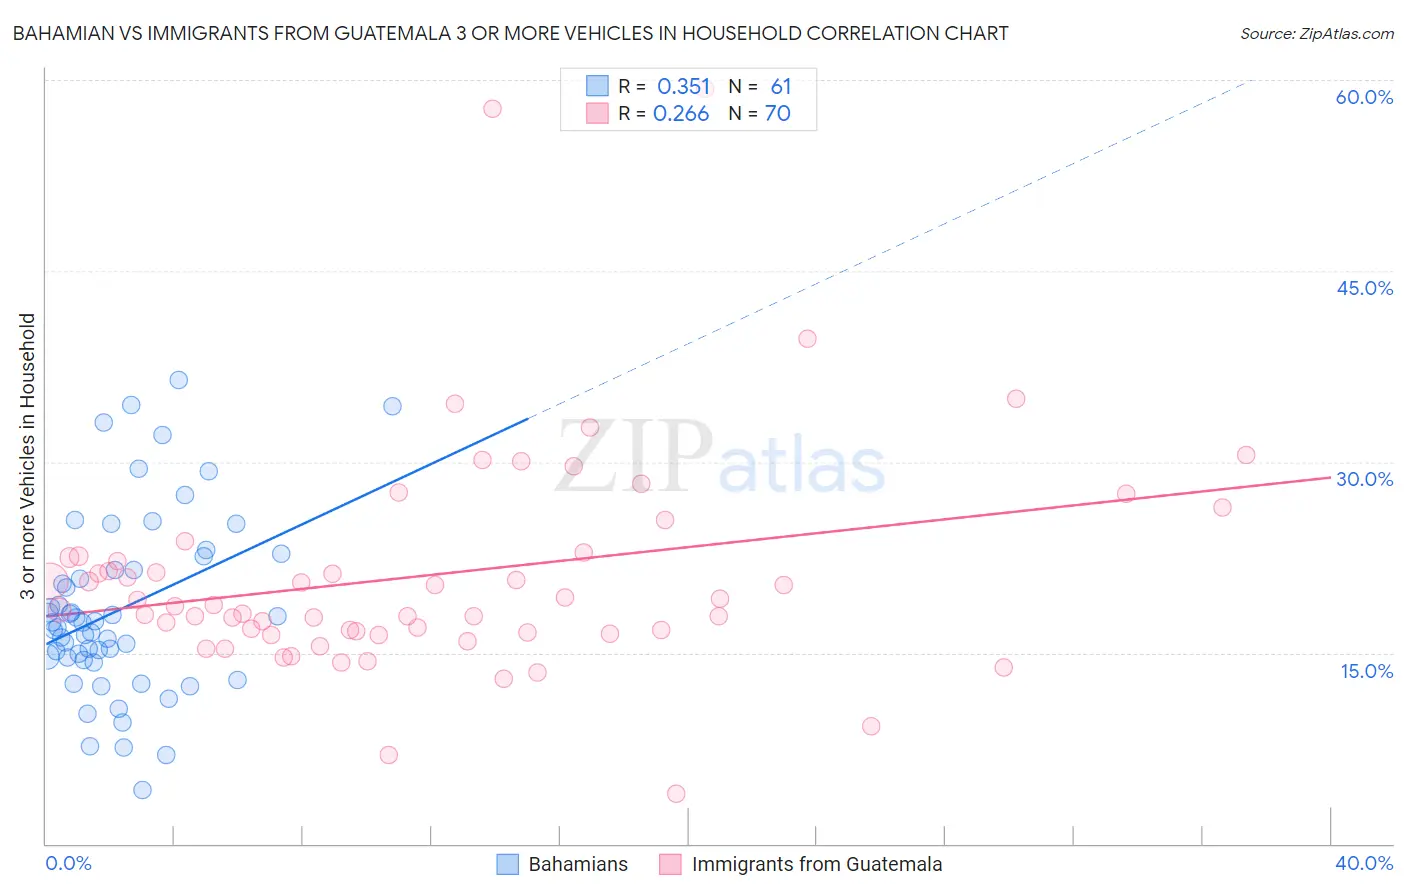
Bahamian vs Immigrants from Guatemala 3 or more Vehicles in Household Correlation Chart
The statistical analysis conducted on geographies consisting of 112,623,128 people shows a mild positive correlation between the proportion of Bahamians and percentage of households with 3 or more vehicles available in the United States with a correlation coefficient (R) of 0.351 and weighted average of 16.9%. Similarly, the statistical analysis conducted on geographies consisting of 377,138,976 people shows a weak positive correlation between the proportion of Immigrants from Guatemala and percentage of households with 3 or more vehicles available in the United States with a correlation coefficient (R) of 0.266 and weighted average of 19.7%, a difference of 16.5%.
3 or more Vehicles in Household Correlation Summary
| Measurement | Bahamian | Immigrants from Guatemala |
| Minimum | 4.2% | 3.9% |
| Maximum | 36.4% | 59.3% |
| Range | 32.2% | 55.5% |
| Mean | 18.4% | 21.1% |
| Median | 17.4% | 18.7% |
| Interquartile 25% (IQ1) | 14.5% | 16.6% |
| Interquartile 75% (IQ3) | 22.1% | 22.6% |
| Interquartile Range (IQR) | 7.5% | 6.0% |
| Standard Deviation (Sample) | 7.1% | 9.0% |
| Standard Deviation (Population) | 7.0% | 9.0% |
Similar Demographics by 3 or more Vehicles in Household
Demographics Similar to Bahamians by 3 or more Vehicles in Household
In terms of 3 or more vehicles in household, the demographic groups most similar to Bahamians are Immigrants from Spain (17.0%, a difference of 0.080%), Immigrants from Western Africa (16.9%, a difference of 0.11%), Immigrants from Russia (16.9%, a difference of 0.16%), Immigrants from Congo (17.0%, a difference of 0.20%), and Liberian (17.0%, a difference of 0.35%).
| Demographics | Rating | Rank | 3 or more Vehicles in Household |
| Menominee | 0.2 /100 | #286 | Tragic 17.2% |
| Immigrants | Brazil | 0.2 /100 | #287 | Tragic 17.1% |
| Immigrants | Uruguay | 0.2 /100 | #288 | Tragic 17.1% |
| Immigrants | Liberia | 0.1 /100 | #289 | Tragic 17.1% |
| Liberians | 0.1 /100 | #290 | Tragic 17.0% |
| Immigrants | Congo | 0.1 /100 | #291 | Tragic 17.0% |
| Immigrants | Spain | 0.1 /100 | #292 | Tragic 17.0% |
| Bahamians | 0.1 /100 | #293 | Tragic 16.9% |
| Immigrants | Western Africa | 0.1 /100 | #294 | Tragic 16.9% |
| Immigrants | Russia | 0.1 /100 | #295 | Tragic 16.9% |
| Inupiat | 0.1 /100 | #296 | Tragic 16.9% |
| Israelis | 0.1 /100 | #297 | Tragic 16.8% |
| Immigrants | Zaire | 0.1 /100 | #298 | Tragic 16.7% |
| Immigrants | South America | 0.1 /100 | #299 | Tragic 16.7% |
| Cypriots | 0.0 /100 | #300 | Tragic 16.6% |
Demographics Similar to Immigrants from Guatemala by 3 or more Vehicles in Household
In terms of 3 or more vehicles in household, the demographic groups most similar to Immigrants from Guatemala are Immigrants from Lebanon (19.8%, a difference of 0.16%), Estonian (19.7%, a difference of 0.19%), Chilean (19.7%, a difference of 0.21%), Immigrants from Pakistan (19.8%, a difference of 0.22%), and Yugoslavian (19.7%, a difference of 0.22%).
| Demographics | Rating | Rank | 3 or more Vehicles in Household |
| Immigrants | Jordan | 75.0 /100 | #154 | Good 19.9% |
| Tlingit-Haida | 73.4 /100 | #155 | Good 19.9% |
| Thais | 71.1 /100 | #156 | Good 19.8% |
| Hungarians | 70.5 /100 | #157 | Good 19.8% |
| Armenians | 68.8 /100 | #158 | Good 19.8% |
| Immigrants | Pakistan | 68.2 /100 | #159 | Good 19.8% |
| Immigrants | Lebanon | 67.6 /100 | #160 | Good 19.8% |
| Immigrants | Guatemala | 65.6 /100 | #161 | Good 19.7% |
| Estonians | 63.2 /100 | #162 | Good 19.7% |
| Chileans | 63.0 /100 | #163 | Good 19.7% |
| Yugoslavians | 62.9 /100 | #164 | Good 19.7% |
| Immigrants | Costa Rica | 61.9 /100 | #165 | Good 19.7% |
| Immigrants | Cameroon | 60.9 /100 | #166 | Good 19.7% |
| Ukrainians | 58.9 /100 | #167 | Average 19.6% |
| Peruvians | 58.8 /100 | #168 | Average 19.6% |