Scotch-Irish vs Immigrants from Guatemala 3 or more Vehicles in Household
COMPARE
Scotch-Irish
Immigrants from Guatemala
3 or more Vehicles in Household
3 or more Vehicles in Household Comparison
Scotch-Irish
Immigrants from Guatemala
22.6%
3 OR MORE VEHICLES IN HOUSEHOLD
100.0/ 100
METRIC RATING
49th/ 347
METRIC RANK
19.7%
3 OR MORE VEHICLES IN HOUSEHOLD
65.6/ 100
METRIC RATING
161st/ 347
METRIC RANK
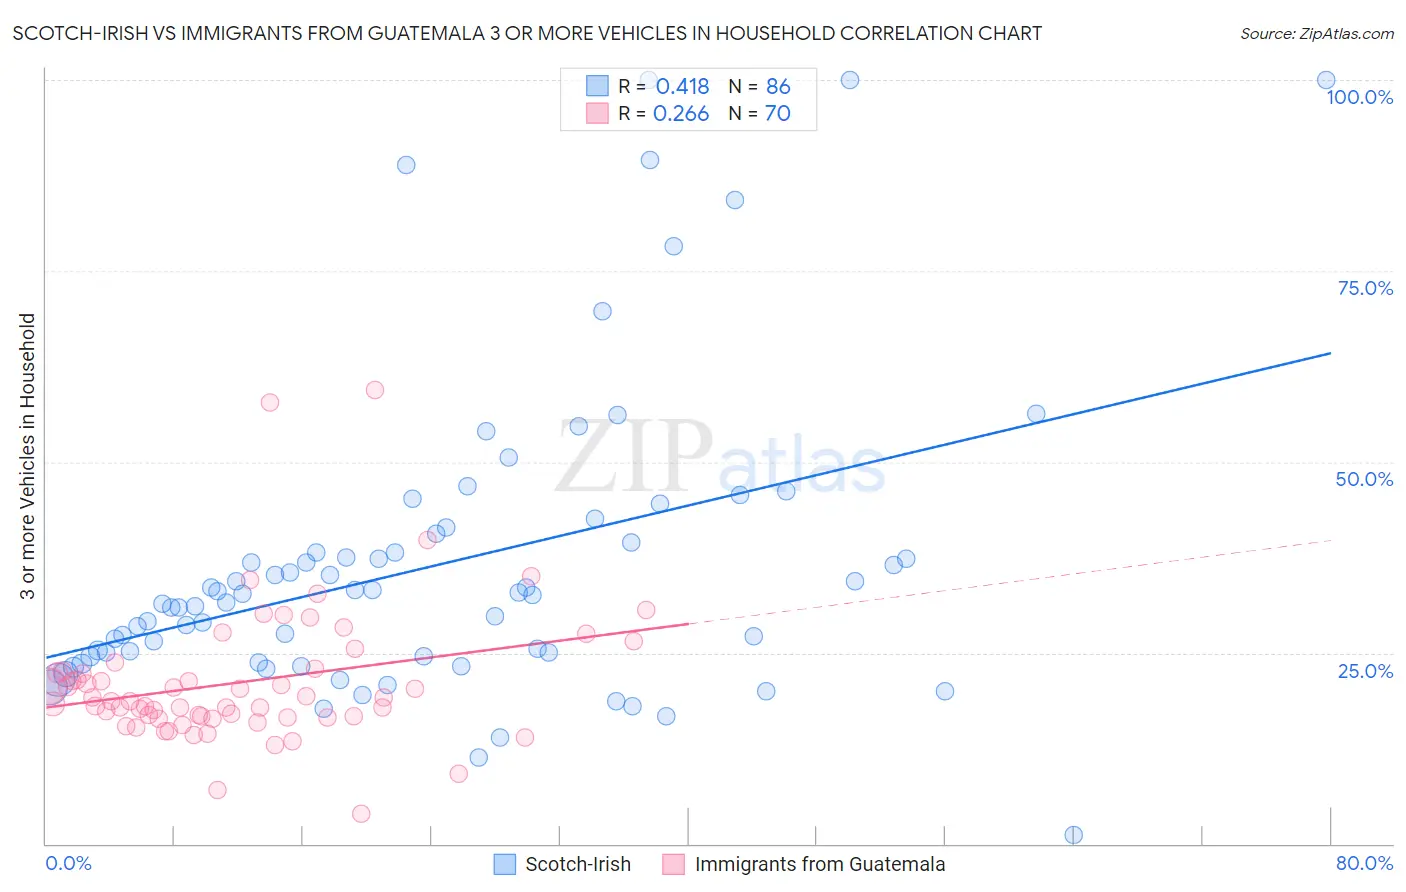
Scotch-Irish vs Immigrants from Guatemala 3 or more Vehicles in Household Correlation Chart
The statistical analysis conducted on geographies consisting of 548,181,208 people shows a moderate positive correlation between the proportion of Scotch-Irish and percentage of households with 3 or more vehicles available in the United States with a correlation coefficient (R) of 0.418 and weighted average of 22.6%. Similarly, the statistical analysis conducted on geographies consisting of 377,138,976 people shows a weak positive correlation between the proportion of Immigrants from Guatemala and percentage of households with 3 or more vehicles available in the United States with a correlation coefficient (R) of 0.266 and weighted average of 19.7%, a difference of 14.5%.
3 or more Vehicles in Household Correlation Summary
| Measurement | Scotch-Irish | Immigrants from Guatemala |
| Minimum | 1.1% | 3.9% |
| Maximum | 100.0% | 59.3% |
| Range | 98.9% | 55.5% |
| Mean | 36.4% | 21.1% |
| Median | 32.1% | 18.7% |
| Interquartile 25% (IQ1) | 24.5% | 16.6% |
| Interquartile 75% (IQ3) | 39.5% | 22.6% |
| Interquartile Range (IQR) | 15.0% | 6.0% |
| Standard Deviation (Sample) | 19.9% | 9.0% |
| Standard Deviation (Population) | 19.8% | 9.0% |
Similar Demographics by 3 or more Vehicles in Household
Demographics Similar to Scotch-Irish by 3 or more Vehicles in Household
In terms of 3 or more vehicles in household, the demographic groups most similar to Scotch-Irish are Sioux (22.6%, a difference of 0.060%), White/Caucasian (22.6%, a difference of 0.060%), Scottish (22.6%, a difference of 0.10%), Malaysian (22.6%, a difference of 0.11%), and Welsh (22.6%, a difference of 0.11%).
| Demographics | Rating | Rank | 3 or more Vehicles in Household |
| Natives/Alaskans | 100.0 /100 | #42 | Exceptional 22.7% |
| Osage | 100.0 /100 | #43 | Exceptional 22.7% |
| Cheyenne | 100.0 /100 | #44 | Exceptional 22.7% |
| Ute | 100.0 /100 | #45 | Exceptional 22.7% |
| Americans | 100.0 /100 | #46 | Exceptional 22.6% |
| Malaysians | 100.0 /100 | #47 | Exceptional 22.6% |
| Scottish | 100.0 /100 | #48 | Exceptional 22.6% |
| Scotch-Irish | 100.0 /100 | #49 | Exceptional 22.6% |
| Sioux | 100.0 /100 | #50 | Exceptional 22.6% |
| Whites/Caucasians | 100.0 /100 | #51 | Exceptional 22.6% |
| Welsh | 100.0 /100 | #52 | Exceptional 22.6% |
| Czechs | 100.0 /100 | #53 | Exceptional 22.5% |
| Crow | 100.0 /100 | #54 | Exceptional 22.5% |
| Immigrants | Laos | 100.0 /100 | #55 | Exceptional 22.4% |
| Hispanics or Latinos | 100.0 /100 | #56 | Exceptional 22.4% |
Demographics Similar to Immigrants from Guatemala by 3 or more Vehicles in Household
In terms of 3 or more vehicles in household, the demographic groups most similar to Immigrants from Guatemala are Immigrants from Lebanon (19.8%, a difference of 0.16%), Estonian (19.7%, a difference of 0.19%), Chilean (19.7%, a difference of 0.21%), Immigrants from Pakistan (19.8%, a difference of 0.22%), and Yugoslavian (19.7%, a difference of 0.22%).
| Demographics | Rating | Rank | 3 or more Vehicles in Household |
| Immigrants | Jordan | 75.0 /100 | #154 | Good 19.9% |
| Tlingit-Haida | 73.4 /100 | #155 | Good 19.9% |
| Thais | 71.1 /100 | #156 | Good 19.8% |
| Hungarians | 70.5 /100 | #157 | Good 19.8% |
| Armenians | 68.8 /100 | #158 | Good 19.8% |
| Immigrants | Pakistan | 68.2 /100 | #159 | Good 19.8% |
| Immigrants | Lebanon | 67.6 /100 | #160 | Good 19.8% |
| Immigrants | Guatemala | 65.6 /100 | #161 | Good 19.7% |
| Estonians | 63.2 /100 | #162 | Good 19.7% |
| Chileans | 63.0 /100 | #163 | Good 19.7% |
| Yugoslavians | 62.9 /100 | #164 | Good 19.7% |
| Immigrants | Costa Rica | 61.9 /100 | #165 | Good 19.7% |
| Immigrants | Cameroon | 60.9 /100 | #166 | Good 19.7% |
| Ukrainians | 58.9 /100 | #167 | Average 19.6% |
| Peruvians | 58.8 /100 | #168 | Average 19.6% |