Cape Verdean vs Immigrants from Guatemala 3 or more Vehicles in Household
COMPARE
Cape Verdean
Immigrants from Guatemala
3 or more Vehicles in Household
3 or more Vehicles in Household Comparison
Cape Verdeans
Immigrants from Guatemala
15.0%
3 OR MORE VEHICLES IN HOUSEHOLD
0.0/ 100
METRIC RATING
319th/ 347
METRIC RANK
19.7%
3 OR MORE VEHICLES IN HOUSEHOLD
65.6/ 100
METRIC RATING
161st/ 347
METRIC RANK
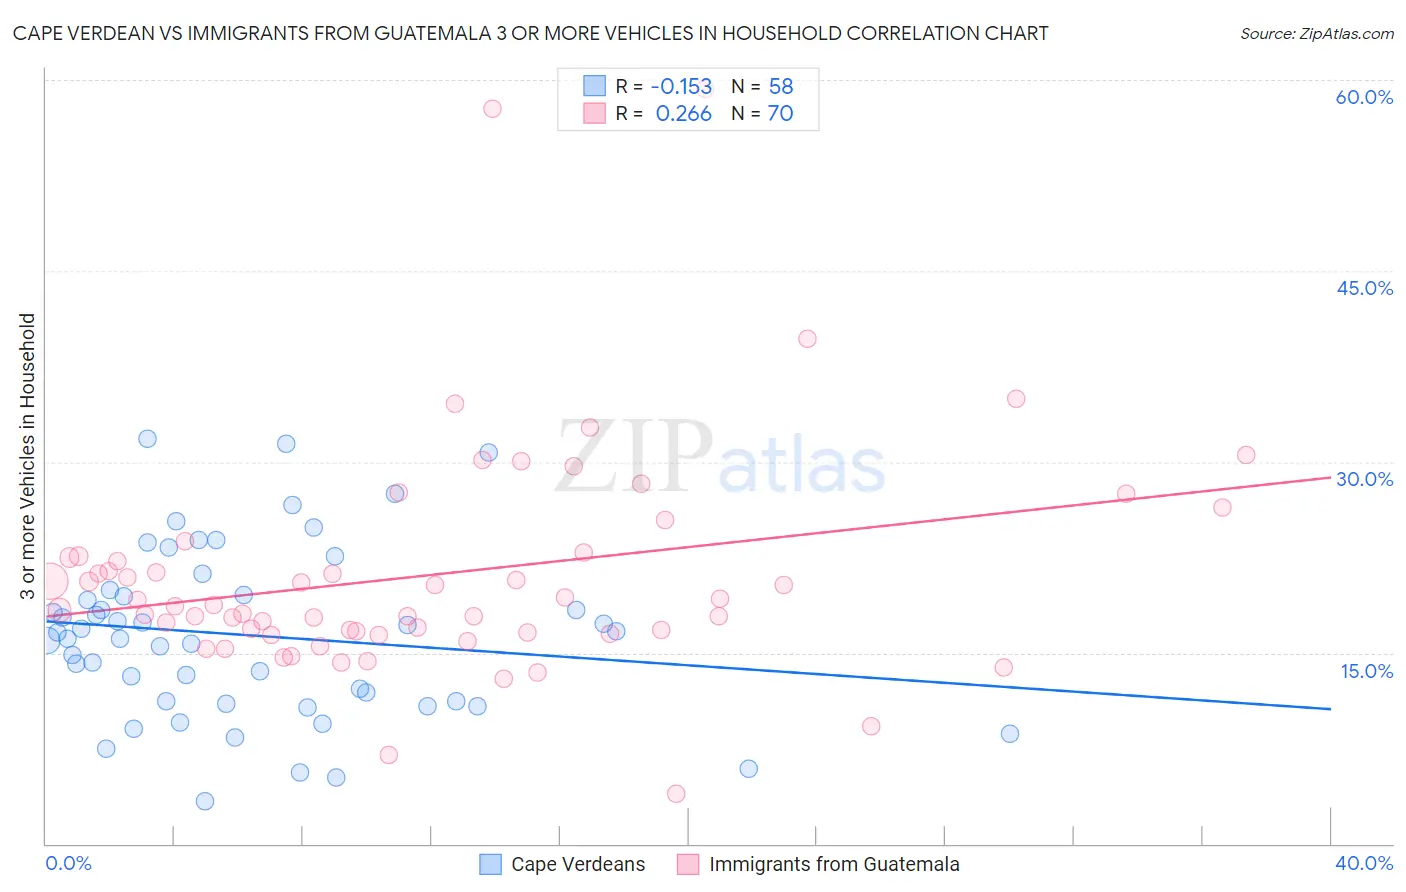
Cape Verdean vs Immigrants from Guatemala 3 or more Vehicles in Household Correlation Chart
The statistical analysis conducted on geographies consisting of 107,543,887 people shows a poor negative correlation between the proportion of Cape Verdeans and percentage of households with 3 or more vehicles available in the United States with a correlation coefficient (R) of -0.153 and weighted average of 15.0%. Similarly, the statistical analysis conducted on geographies consisting of 377,138,976 people shows a weak positive correlation between the proportion of Immigrants from Guatemala and percentage of households with 3 or more vehicles available in the United States with a correlation coefficient (R) of 0.266 and weighted average of 19.7%, a difference of 31.6%.
3 or more Vehicles in Household Correlation Summary
| Measurement | Cape Verdean | Immigrants from Guatemala |
| Minimum | 3.3% | 3.9% |
| Maximum | 31.8% | 59.3% |
| Range | 28.5% | 55.5% |
| Mean | 16.4% | 21.1% |
| Median | 16.3% | 18.7% |
| Interquartile 25% (IQ1) | 11.2% | 16.6% |
| Interquartile 75% (IQ3) | 19.5% | 22.6% |
| Interquartile Range (IQR) | 8.4% | 6.0% |
| Standard Deviation (Sample) | 6.6% | 9.0% |
| Standard Deviation (Population) | 6.6% | 9.0% |
Similar Demographics by 3 or more Vehicles in Household
Demographics Similar to Cape Verdeans by 3 or more Vehicles in Household
In terms of 3 or more vehicles in household, the demographic groups most similar to Cape Verdeans are Yup'ik (14.8%, a difference of 1.1%), Immigrants from Haiti (15.2%, a difference of 1.2%), Jamaican (15.2%, a difference of 1.4%), Immigrants from Jamaica (14.7%, a difference of 2.2%), and Immigrants from West Indies (14.6%, a difference of 2.5%).
| Demographics | Rating | Rank | 3 or more Vehicles in Household |
| Puerto Ricans | 0.0 /100 | #312 | Tragic 15.6% |
| Immigrants | Israel | 0.0 /100 | #313 | Tragic 15.6% |
| Immigrants | Belarus | 0.0 /100 | #314 | Tragic 15.5% |
| Haitians | 0.0 /100 | #315 | Tragic 15.5% |
| U.S. Virgin Islanders | 0.0 /100 | #316 | Tragic 15.4% |
| Jamaicans | 0.0 /100 | #317 | Tragic 15.2% |
| Immigrants | Haiti | 0.0 /100 | #318 | Tragic 15.2% |
| Cape Verdeans | 0.0 /100 | #319 | Tragic 15.0% |
| Yup'ik | 0.0 /100 | #320 | Tragic 14.8% |
| Immigrants | Jamaica | 0.0 /100 | #321 | Tragic 14.7% |
| Immigrants | West Indies | 0.0 /100 | #322 | Tragic 14.6% |
| Immigrants | Caribbean | 0.0 /100 | #323 | Tragic 14.6% |
| Immigrants | Yemen | 0.0 /100 | #324 | Tragic 14.2% |
| Senegalese | 0.0 /100 | #325 | Tragic 14.2% |
| Soviet Union | 0.0 /100 | #326 | Tragic 14.2% |
Demographics Similar to Immigrants from Guatemala by 3 or more Vehicles in Household
In terms of 3 or more vehicles in household, the demographic groups most similar to Immigrants from Guatemala are Immigrants from Lebanon (19.8%, a difference of 0.16%), Estonian (19.7%, a difference of 0.19%), Chilean (19.7%, a difference of 0.21%), Immigrants from Pakistan (19.8%, a difference of 0.22%), and Yugoslavian (19.7%, a difference of 0.22%).
| Demographics | Rating | Rank | 3 or more Vehicles in Household |
| Immigrants | Jordan | 75.0 /100 | #154 | Good 19.9% |
| Tlingit-Haida | 73.4 /100 | #155 | Good 19.9% |
| Thais | 71.1 /100 | #156 | Good 19.8% |
| Hungarians | 70.5 /100 | #157 | Good 19.8% |
| Armenians | 68.8 /100 | #158 | Good 19.8% |
| Immigrants | Pakistan | 68.2 /100 | #159 | Good 19.8% |
| Immigrants | Lebanon | 67.6 /100 | #160 | Good 19.8% |
| Immigrants | Guatemala | 65.6 /100 | #161 | Good 19.7% |
| Estonians | 63.2 /100 | #162 | Good 19.7% |
| Chileans | 63.0 /100 | #163 | Good 19.7% |
| Yugoslavians | 62.9 /100 | #164 | Good 19.7% |
| Immigrants | Costa Rica | 61.9 /100 | #165 | Good 19.7% |
| Immigrants | Cameroon | 60.9 /100 | #166 | Good 19.7% |
| Ukrainians | 58.9 /100 | #167 | Average 19.6% |
| Peruvians | 58.8 /100 | #168 | Average 19.6% |