Guatemalan vs Immigrants from Singapore 3 or more Vehicles in Household
COMPARE
Guatemalan
Immigrants from Singapore
3 or more Vehicles in Household
3 or more Vehicles in Household Comparison
Guatemalans
Immigrants from Singapore
20.1%
3 OR MORE VEHICLES IN HOUSEHOLD
82.6/ 100
METRIC RATING
148th/ 347
METRIC RANK
18.4%
3 OR MORE VEHICLES IN HOUSEHOLD
5.4/ 100
METRIC RATING
227th/ 347
METRIC RANK
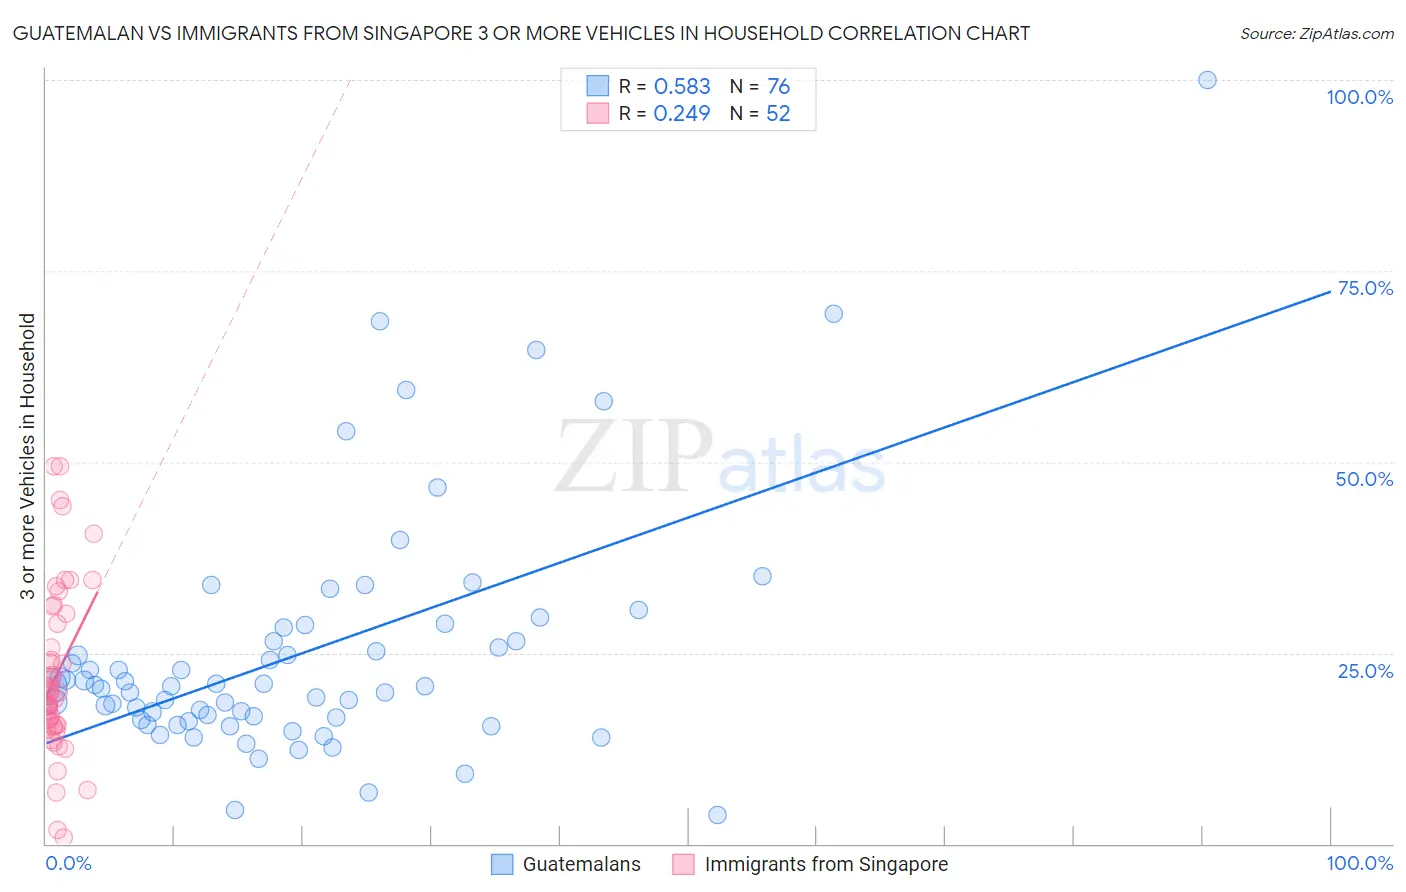
Guatemalan vs Immigrants from Singapore 3 or more Vehicles in Household Correlation Chart
The statistical analysis conducted on geographies consisting of 409,244,641 people shows a substantial positive correlation between the proportion of Guatemalans and percentage of households with 3 or more vehicles available in the United States with a correlation coefficient (R) of 0.583 and weighted average of 20.1%. Similarly, the statistical analysis conducted on geographies consisting of 137,391,335 people shows a weak positive correlation between the proportion of Immigrants from Singapore and percentage of households with 3 or more vehicles available in the United States with a correlation coefficient (R) of 0.249 and weighted average of 18.4%, a difference of 8.8%.
3 or more Vehicles in Household Correlation Summary
| Measurement | Guatemalan | Immigrants from Singapore |
| Minimum | 3.8% | 0.75% |
| Maximum | 100.0% | 49.4% |
| Range | 96.2% | 48.7% |
| Mean | 25.1% | 22.1% |
| Median | 20.6% | 19.7% |
| Interquartile 25% (IQ1) | 16.3% | 15.5% |
| Interquartile 75% (IQ3) | 27.4% | 29.4% |
| Interquartile Range (IQR) | 11.1% | 13.9% |
| Standard Deviation (Sample) | 16.1% | 11.0% |
| Standard Deviation (Population) | 16.0% | 10.9% |
Similar Demographics by 3 or more Vehicles in Household
Demographics Similar to Guatemalans by 3 or more Vehicles in Household
In terms of 3 or more vehicles in household, the demographic groups most similar to Guatemalans are Slovak (20.1%, a difference of 0.060%), Australian (20.1%, a difference of 0.14%), Palestinian (20.1%, a difference of 0.18%), Iranian (20.1%, a difference of 0.19%), and Immigrants from Iran (20.0%, a difference of 0.20%).
| Demographics | Rating | Rank | 3 or more Vehicles in Household |
| Ottawa | 84.9 /100 | #141 | Excellent 20.1% |
| Jordanians | 84.4 /100 | #142 | Excellent 20.1% |
| Lithuanians | 84.4 /100 | #143 | Excellent 20.1% |
| Iranians | 84.0 /100 | #144 | Excellent 20.1% |
| Palestinians | 83.9 /100 | #145 | Excellent 20.1% |
| Australians | 83.6 /100 | #146 | Excellent 20.1% |
| Slovaks | 83.0 /100 | #147 | Excellent 20.1% |
| Guatemalans | 82.6 /100 | #148 | Excellent 20.1% |
| Immigrants | Iran | 80.9 /100 | #149 | Excellent 20.0% |
| Immigrants | Immigrants | 80.8 /100 | #150 | Excellent 20.0% |
| Taiwanese | 80.6 /100 | #151 | Excellent 20.0% |
| Lebanese | 79.8 /100 | #152 | Good 20.0% |
| Yuman | 75.6 /100 | #153 | Good 19.9% |
| Immigrants | Jordan | 75.0 /100 | #154 | Good 19.9% |
| Tlingit-Haida | 73.4 /100 | #155 | Good 19.9% |
Demographics Similar to Immigrants from Singapore by 3 or more Vehicles in Household
In terms of 3 or more vehicles in household, the demographic groups most similar to Immigrants from Singapore are Turkish (18.4%, a difference of 0.020%), Immigrants from Hungary (18.5%, a difference of 0.030%), Immigrants from Lithuania (18.5%, a difference of 0.060%), Immigrants from Argentina (18.5%, a difference of 0.070%), and Immigrants from Czechoslovakia (18.5%, a difference of 0.17%).
| Demographics | Rating | Rank | 3 or more Vehicles in Household |
| Nigerians | 7.9 /100 | #220 | Tragic 18.6% |
| Immigrants | Poland | 7.5 /100 | #221 | Tragic 18.6% |
| Belizeans | 7.3 /100 | #222 | Tragic 18.6% |
| Immigrants | Czechoslovakia | 5.9 /100 | #223 | Tragic 18.5% |
| Immigrants | Argentina | 5.6 /100 | #224 | Tragic 18.5% |
| Immigrants | Lithuania | 5.6 /100 | #225 | Tragic 18.5% |
| Immigrants | Hungary | 5.5 /100 | #226 | Tragic 18.5% |
| Immigrants | Singapore | 5.4 /100 | #227 | Tragic 18.4% |
| Turks | 5.4 /100 | #228 | Tragic 18.4% |
| Immigrants | Switzerland | 5.0 /100 | #229 | Tragic 18.4% |
| Immigrants | Western Asia | 4.8 /100 | #230 | Tragic 18.4% |
| Immigrants | Belgium | 4.8 /100 | #231 | Tragic 18.4% |
| Immigrants | Uganda | 4.6 /100 | #232 | Tragic 18.4% |
| Hondurans | 4.6 /100 | #233 | Tragic 18.4% |
| Immigrants | North Macedonia | 4.4 /100 | #234 | Tragic 18.4% |