Guatemalan vs Iranian 3 or more Vehicles in Household
COMPARE
Guatemalan
Iranian
3 or more Vehicles in Household
3 or more Vehicles in Household Comparison
Guatemalans
Iranians
20.1%
3 OR MORE VEHICLES IN HOUSEHOLD
82.6/ 100
METRIC RATING
148th/ 347
METRIC RANK
20.1%
3 OR MORE VEHICLES IN HOUSEHOLD
84.0/ 100
METRIC RATING
144th/ 347
METRIC RANK
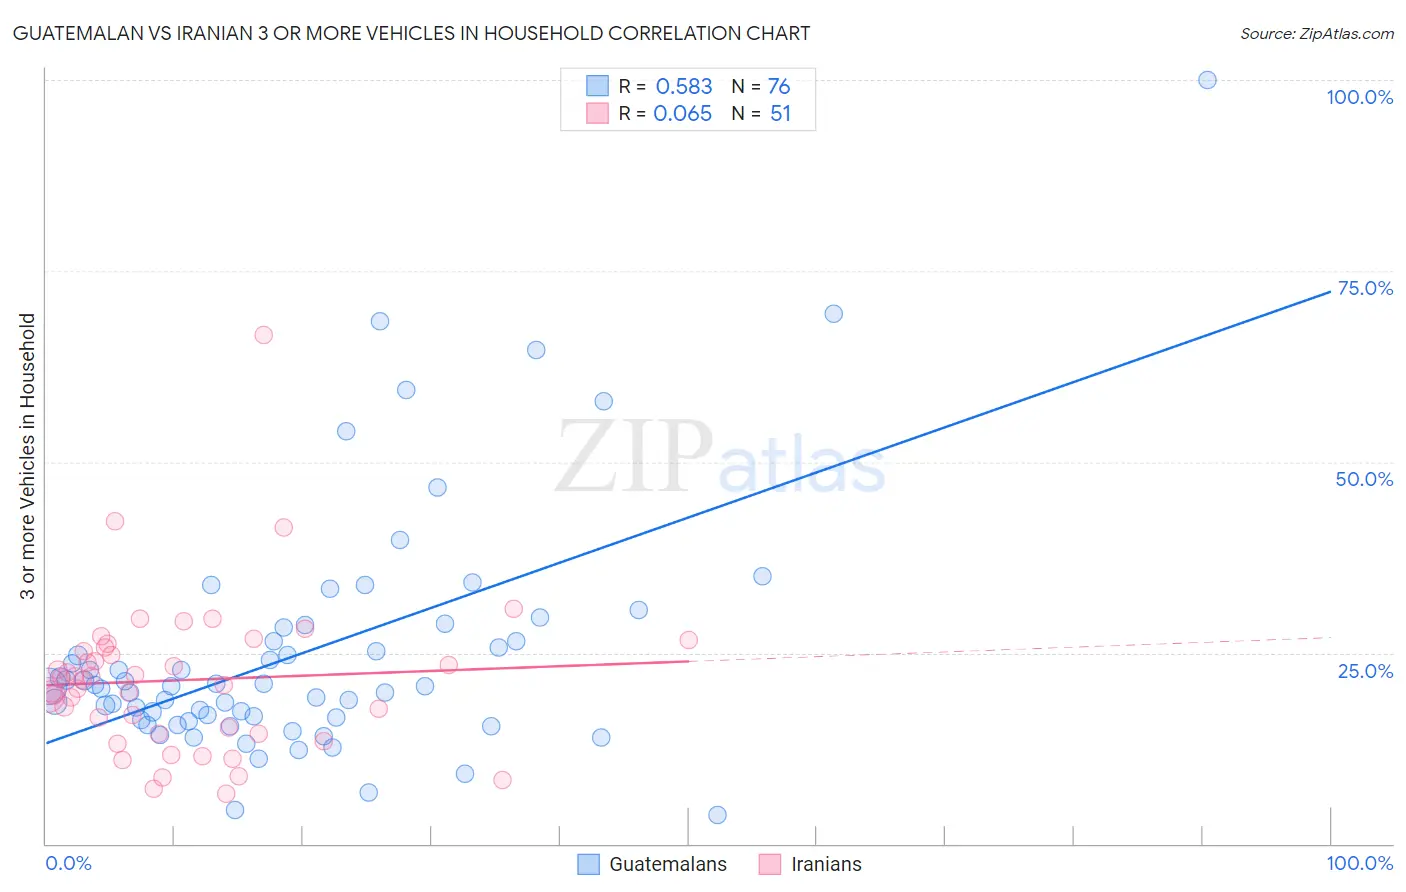
Guatemalan vs Iranian 3 or more Vehicles in Household Correlation Chart
The statistical analysis conducted on geographies consisting of 409,244,641 people shows a substantial positive correlation between the proportion of Guatemalans and percentage of households with 3 or more vehicles available in the United States with a correlation coefficient (R) of 0.583 and weighted average of 20.1%. Similarly, the statistical analysis conducted on geographies consisting of 316,534,374 people shows a slight positive correlation between the proportion of Iranians and percentage of households with 3 or more vehicles available in the United States with a correlation coefficient (R) of 0.065 and weighted average of 20.1%, a difference of 0.19%.
3 or more Vehicles in Household Correlation Summary
| Measurement | Guatemalan | Iranian |
| Minimum | 3.8% | 6.6% |
| Maximum | 100.0% | 66.7% |
| Range | 96.2% | 60.1% |
| Mean | 25.1% | 21.4% |
| Median | 20.6% | 21.4% |
| Interquartile 25% (IQ1) | 16.3% | 14.4% |
| Interquartile 75% (IQ3) | 27.4% | 25.7% |
| Interquartile Range (IQR) | 11.1% | 11.3% |
| Standard Deviation (Sample) | 16.1% | 10.1% |
| Standard Deviation (Population) | 16.0% | 10.0% |
Demographics Similar to Guatemalans and Iranians by 3 or more Vehicles in Household
In terms of 3 or more vehicles in household, the demographic groups most similar to Guatemalans are Slovak (20.1%, a difference of 0.060%), Australian (20.1%, a difference of 0.14%), Palestinian (20.1%, a difference of 0.18%), Immigrants from Iran (20.0%, a difference of 0.20%), and Immigrants (20.0%, a difference of 0.22%). Similarly, the demographic groups most similar to Iranians are Palestinian (20.1%, a difference of 0.010%), Lithuanian (20.1%, a difference of 0.050%), Australian (20.1%, a difference of 0.050%), Jordanian (20.1%, a difference of 0.060%), and Ottawa (20.1%, a difference of 0.12%).
| Demographics | Rating | Rank | 3 or more Vehicles in Household |
| Immigrants | Nicaragua | 87.1 /100 | #136 | Excellent 20.2% |
| Immigrants | Iraq | 87.1 /100 | #137 | Excellent 20.2% |
| Aleuts | 86.3 /100 | #138 | Excellent 20.2% |
| Slovenes | 85.5 /100 | #139 | Excellent 20.2% |
| French American Indians | 85.3 /100 | #140 | Excellent 20.1% |
| Ottawa | 84.9 /100 | #141 | Excellent 20.1% |
| Jordanians | 84.4 /100 | #142 | Excellent 20.1% |
| Lithuanians | 84.4 /100 | #143 | Excellent 20.1% |
| Iranians | 84.0 /100 | #144 | Excellent 20.1% |
| Palestinians | 83.9 /100 | #145 | Excellent 20.1% |
| Australians | 83.6 /100 | #146 | Excellent 20.1% |
| Slovaks | 83.0 /100 | #147 | Excellent 20.1% |
| Guatemalans | 82.6 /100 | #148 | Excellent 20.1% |
| Immigrants | Iran | 80.9 /100 | #149 | Excellent 20.0% |
| Immigrants | Immigrants | 80.8 /100 | #150 | Excellent 20.0% |
| Taiwanese | 80.6 /100 | #151 | Excellent 20.0% |
| Lebanese | 79.8 /100 | #152 | Good 20.0% |
| Yuman | 75.6 /100 | #153 | Good 19.9% |
| Immigrants | Jordan | 75.0 /100 | #154 | Good 19.9% |
| Tlingit-Haida | 73.4 /100 | #155 | Good 19.9% |
| Thais | 71.1 /100 | #156 | Good 19.8% |