Guatemalan vs Ute 3 or more Vehicles in Household
COMPARE
Guatemalan
Ute
3 or more Vehicles in Household
3 or more Vehicles in Household Comparison
Guatemalans
Ute
20.1%
3 OR MORE VEHICLES IN HOUSEHOLD
82.6/ 100
METRIC RATING
148th/ 347
METRIC RANK
22.7%
3 OR MORE VEHICLES IN HOUSEHOLD
100.0/ 100
METRIC RATING
45th/ 347
METRIC RANK
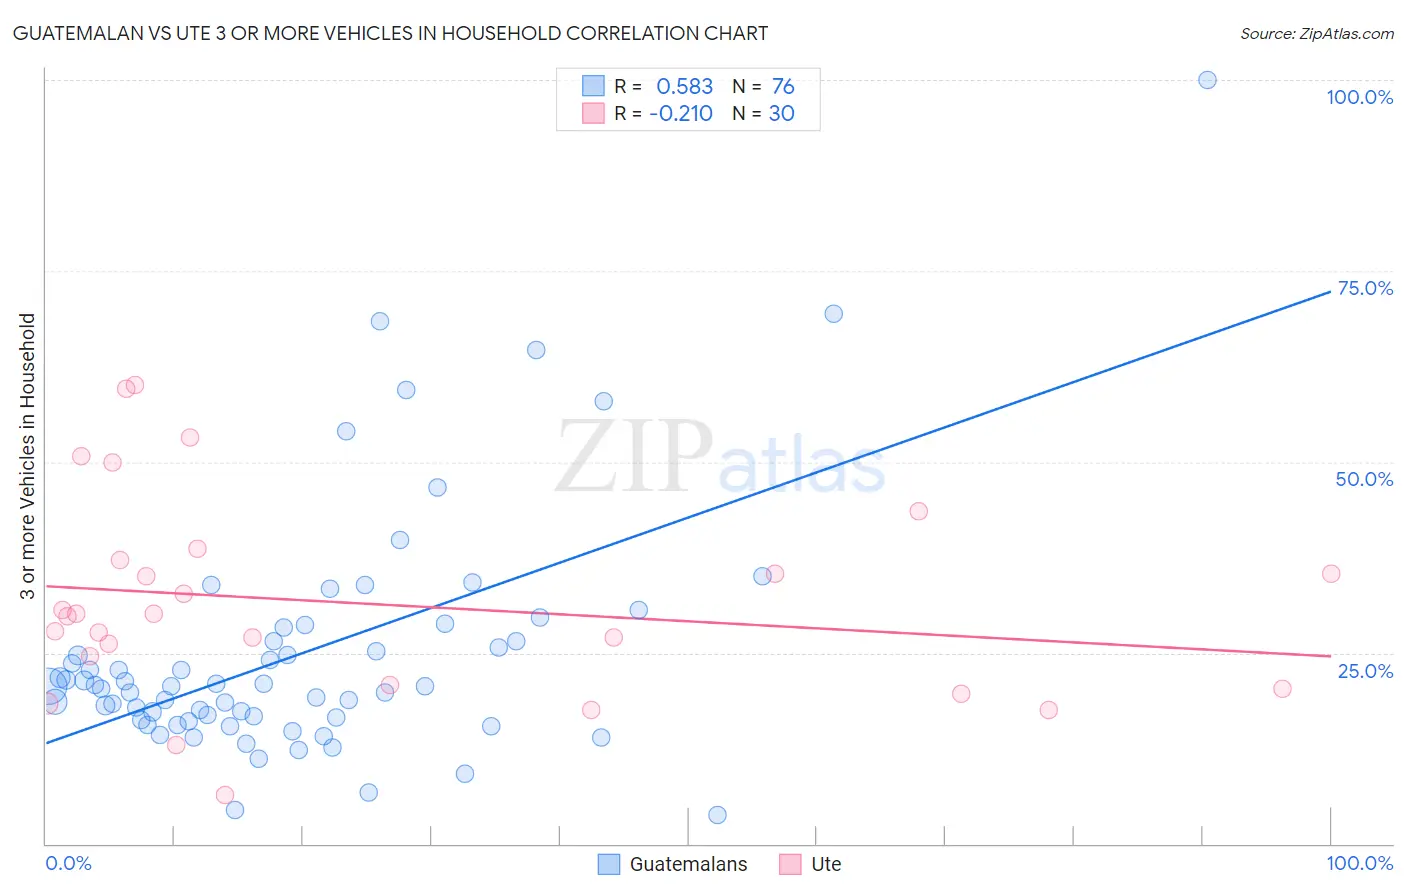
Guatemalan vs Ute 3 or more Vehicles in Household Correlation Chart
The statistical analysis conducted on geographies consisting of 409,244,641 people shows a substantial positive correlation between the proportion of Guatemalans and percentage of households with 3 or more vehicles available in the United States with a correlation coefficient (R) of 0.583 and weighted average of 20.1%. Similarly, the statistical analysis conducted on geographies consisting of 55,668,268 people shows a weak negative correlation between the proportion of Ute and percentage of households with 3 or more vehicles available in the United States with a correlation coefficient (R) of -0.210 and weighted average of 22.7%, a difference of 12.9%.
3 or more Vehicles in Household Correlation Summary
| Measurement | Guatemalan | Ute |
| Minimum | 3.8% | 6.3% |
| Maximum | 100.0% | 60.0% |
| Range | 96.2% | 53.7% |
| Mean | 25.1% | 31.5% |
| Median | 20.6% | 29.9% |
| Interquartile 25% (IQ1) | 16.3% | 20.8% |
| Interquartile 75% (IQ3) | 27.4% | 37.1% |
| Interquartile Range (IQR) | 11.1% | 16.3% |
| Standard Deviation (Sample) | 16.1% | 13.3% |
| Standard Deviation (Population) | 16.0% | 13.1% |
Similar Demographics by 3 or more Vehicles in Household
Demographics Similar to Guatemalans by 3 or more Vehicles in Household
In terms of 3 or more vehicles in household, the demographic groups most similar to Guatemalans are Slovak (20.1%, a difference of 0.060%), Australian (20.1%, a difference of 0.14%), Palestinian (20.1%, a difference of 0.18%), Iranian (20.1%, a difference of 0.19%), and Immigrants from Iran (20.0%, a difference of 0.20%).
| Demographics | Rating | Rank | 3 or more Vehicles in Household |
| Ottawa | 84.9 /100 | #141 | Excellent 20.1% |
| Jordanians | 84.4 /100 | #142 | Excellent 20.1% |
| Lithuanians | 84.4 /100 | #143 | Excellent 20.1% |
| Iranians | 84.0 /100 | #144 | Excellent 20.1% |
| Palestinians | 83.9 /100 | #145 | Excellent 20.1% |
| Australians | 83.6 /100 | #146 | Excellent 20.1% |
| Slovaks | 83.0 /100 | #147 | Excellent 20.1% |
| Guatemalans | 82.6 /100 | #148 | Excellent 20.1% |
| Immigrants | Iran | 80.9 /100 | #149 | Excellent 20.0% |
| Immigrants | Immigrants | 80.8 /100 | #150 | Excellent 20.0% |
| Taiwanese | 80.6 /100 | #151 | Excellent 20.0% |
| Lebanese | 79.8 /100 | #152 | Good 20.0% |
| Yuman | 75.6 /100 | #153 | Good 19.9% |
| Immigrants | Jordan | 75.0 /100 | #154 | Good 19.9% |
| Tlingit-Haida | 73.4 /100 | #155 | Good 19.9% |
Demographics Similar to Ute by 3 or more Vehicles in Household
In terms of 3 or more vehicles in household, the demographic groups most similar to Ute are Cheyenne (22.7%, a difference of 0.10%), American (22.6%, a difference of 0.19%), Malaysian (22.6%, a difference of 0.20%), Scottish (22.6%, a difference of 0.21%), and Osage (22.7%, a difference of 0.23%).
| Demographics | Rating | Rank | 3 or more Vehicles in Household |
| Dutch | 100.0 /100 | #38 | Exceptional 22.9% |
| Yaqui | 100.0 /100 | #39 | Exceptional 22.9% |
| Europeans | 100.0 /100 | #40 | Exceptional 22.9% |
| Germans | 100.0 /100 | #41 | Exceptional 22.7% |
| Natives/Alaskans | 100.0 /100 | #42 | Exceptional 22.7% |
| Osage | 100.0 /100 | #43 | Exceptional 22.7% |
| Cheyenne | 100.0 /100 | #44 | Exceptional 22.7% |
| Ute | 100.0 /100 | #45 | Exceptional 22.7% |
| Americans | 100.0 /100 | #46 | Exceptional 22.6% |
| Malaysians | 100.0 /100 | #47 | Exceptional 22.6% |
| Scottish | 100.0 /100 | #48 | Exceptional 22.6% |
| Scotch-Irish | 100.0 /100 | #49 | Exceptional 22.6% |
| Sioux | 100.0 /100 | #50 | Exceptional 22.6% |
| Whites/Caucasians | 100.0 /100 | #51 | Exceptional 22.6% |
| Welsh | 100.0 /100 | #52 | Exceptional 22.6% |