Guatemalan vs Immigrants from Singapore 1st Grade
COMPARE
Guatemalan
Immigrants from Singapore
1st Grade
1st Grade Comparison
Guatemalans
Immigrants from Singapore
96.5%
1ST GRADE
0.0/ 100
METRIC RATING
336th/ 347
METRIC RANK
98.2%
1ST GRADE
96.7/ 100
METRIC RATING
110th/ 347
METRIC RANK
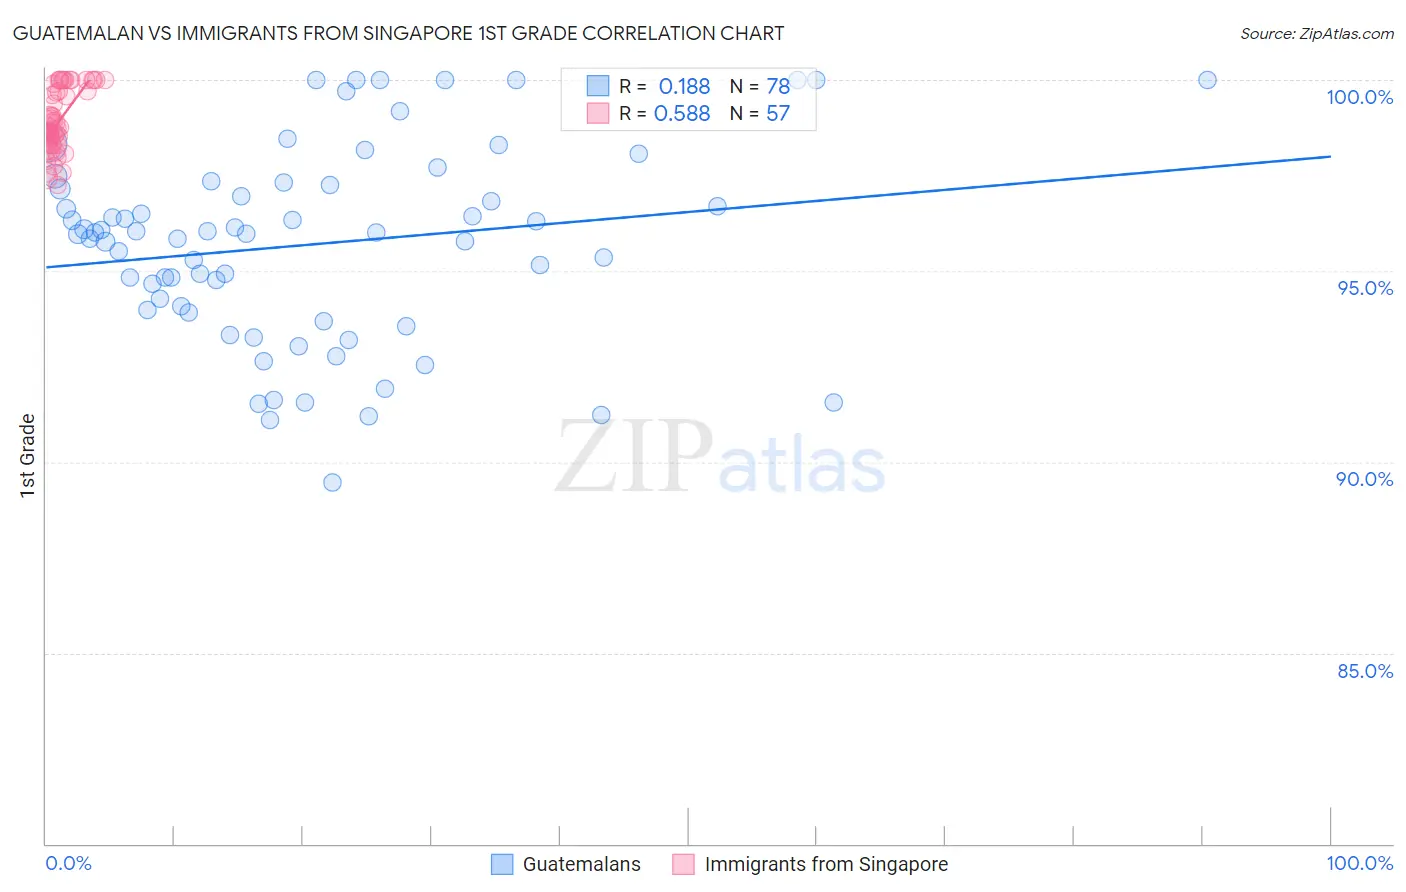
Guatemalan vs Immigrants from Singapore 1st Grade Correlation Chart
The statistical analysis conducted on geographies consisting of 409,566,469 people shows a poor positive correlation between the proportion of Guatemalans and percentage of population with at least 1st grade education in the United States with a correlation coefficient (R) of 0.188 and weighted average of 96.5%. Similarly, the statistical analysis conducted on geographies consisting of 137,521,700 people shows a substantial positive correlation between the proportion of Immigrants from Singapore and percentage of population with at least 1st grade education in the United States with a correlation coefficient (R) of 0.588 and weighted average of 98.2%, a difference of 1.8%.
1st Grade Correlation Summary
| Measurement | Guatemalan | Immigrants from Singapore |
| Minimum | 89.4% | 97.2% |
| Maximum | 100.0% | 100.0% |
| Range | 10.6% | 2.8% |
| Mean | 95.7% | 98.9% |
| Median | 96.0% | 98.7% |
| Interquartile 25% (IQ1) | 94.0% | 98.3% |
| Interquartile 75% (IQ3) | 97.2% | 99.8% |
| Interquartile Range (IQR) | 3.3% | 1.5% |
| Standard Deviation (Sample) | 2.5% | 0.81% |
| Standard Deviation (Population) | 2.5% | 0.81% |
Similar Demographics by 1st Grade
Demographics Similar to Guatemalans by 1st Grade
In terms of 1st grade, the demographic groups most similar to Guatemalans are Yakama (96.5%, a difference of 0.020%), Bangladeshi (96.5%, a difference of 0.040%), Immigrants from Cambodia (96.5%, a difference of 0.040%), Immigrants from Dominican Republic (96.5%, a difference of 0.050%), and Immigrants from Fiji (96.4%, a difference of 0.050%).
| Demographics | Rating | Rank | 1st Grade |
| Japanese | 0.0 /100 | #329 | Tragic 96.6% |
| Immigrants | Vietnam | 0.0 /100 | #330 | Tragic 96.6% |
| Immigrants | Armenia | 0.0 /100 | #331 | Tragic 96.6% |
| Central Americans | 0.0 /100 | #332 | Tragic 96.5% |
| Immigrants | Dominican Republic | 0.0 /100 | #333 | Tragic 96.5% |
| Bangladeshis | 0.0 /100 | #334 | Tragic 96.5% |
| Yakama | 0.0 /100 | #335 | Tragic 96.5% |
| Guatemalans | 0.0 /100 | #336 | Tragic 96.5% |
| Immigrants | Cambodia | 0.0 /100 | #337 | Tragic 96.5% |
| Immigrants | Fiji | 0.0 /100 | #338 | Tragic 96.4% |
| Immigrants | Guatemala | 0.0 /100 | #339 | Tragic 96.4% |
| Immigrants | Cabo Verde | 0.0 /100 | #340 | Tragic 96.3% |
| Immigrants | Central America | 0.0 /100 | #341 | Tragic 96.3% |
| Immigrants | Mexico | 0.0 /100 | #342 | Tragic 96.3% |
| Salvadorans | 0.0 /100 | #343 | Tragic 96.3% |
Demographics Similar to Immigrants from Singapore by 1st Grade
In terms of 1st grade, the demographic groups most similar to Immigrants from Singapore are Immigrants from Czechoslovakia (98.2%, a difference of 0.0%), Immigrants from Norway (98.2%, a difference of 0.0%), German Russian (98.2%, a difference of 0.010%), Immigrants from Latvia (98.2%, a difference of 0.010%), and Ute (98.2%, a difference of 0.010%).
| Demographics | Rating | Rank | 1st Grade |
| Immigrants | Ireland | 97.7 /100 | #103 | Exceptional 98.2% |
| Pima | 97.5 /100 | #104 | Exceptional 98.2% |
| Basques | 97.4 /100 | #105 | Exceptional 98.2% |
| Turks | 97.4 /100 | #106 | Exceptional 98.2% |
| Immigrants | Switzerland | 97.3 /100 | #107 | Exceptional 98.2% |
| Bhutanese | 97.3 /100 | #108 | Exceptional 98.2% |
| German Russians | 97.1 /100 | #109 | Exceptional 98.2% |
| Immigrants | Singapore | 96.7 /100 | #110 | Exceptional 98.2% |
| Immigrants | Czechoslovakia | 96.6 /100 | #111 | Exceptional 98.2% |
| Immigrants | Norway | 96.6 /100 | #112 | Exceptional 98.2% |
| Immigrants | Latvia | 96.4 /100 | #113 | Exceptional 98.2% |
| Ute | 96.2 /100 | #114 | Exceptional 98.2% |
| Iranians | 96.0 /100 | #115 | Exceptional 98.2% |
| Spanish | 95.9 /100 | #116 | Exceptional 98.2% |
| Yugoslavians | 95.5 /100 | #117 | Exceptional 98.2% |