Immigrants from Eastern Europe vs Immigrants from Singapore 3 or more Vehicles in Household
COMPARE
Immigrants from Eastern Europe
Immigrants from Singapore
3 or more Vehicles in Household
3 or more Vehicles in Household Comparison
Immigrants from Eastern Europe
Immigrants from Singapore
17.4%
3 OR MORE VEHICLES IN HOUSEHOLD
0.3/ 100
METRIC RATING
280th/ 347
METRIC RANK
18.4%
3 OR MORE VEHICLES IN HOUSEHOLD
5.4/ 100
METRIC RATING
227th/ 347
METRIC RANK
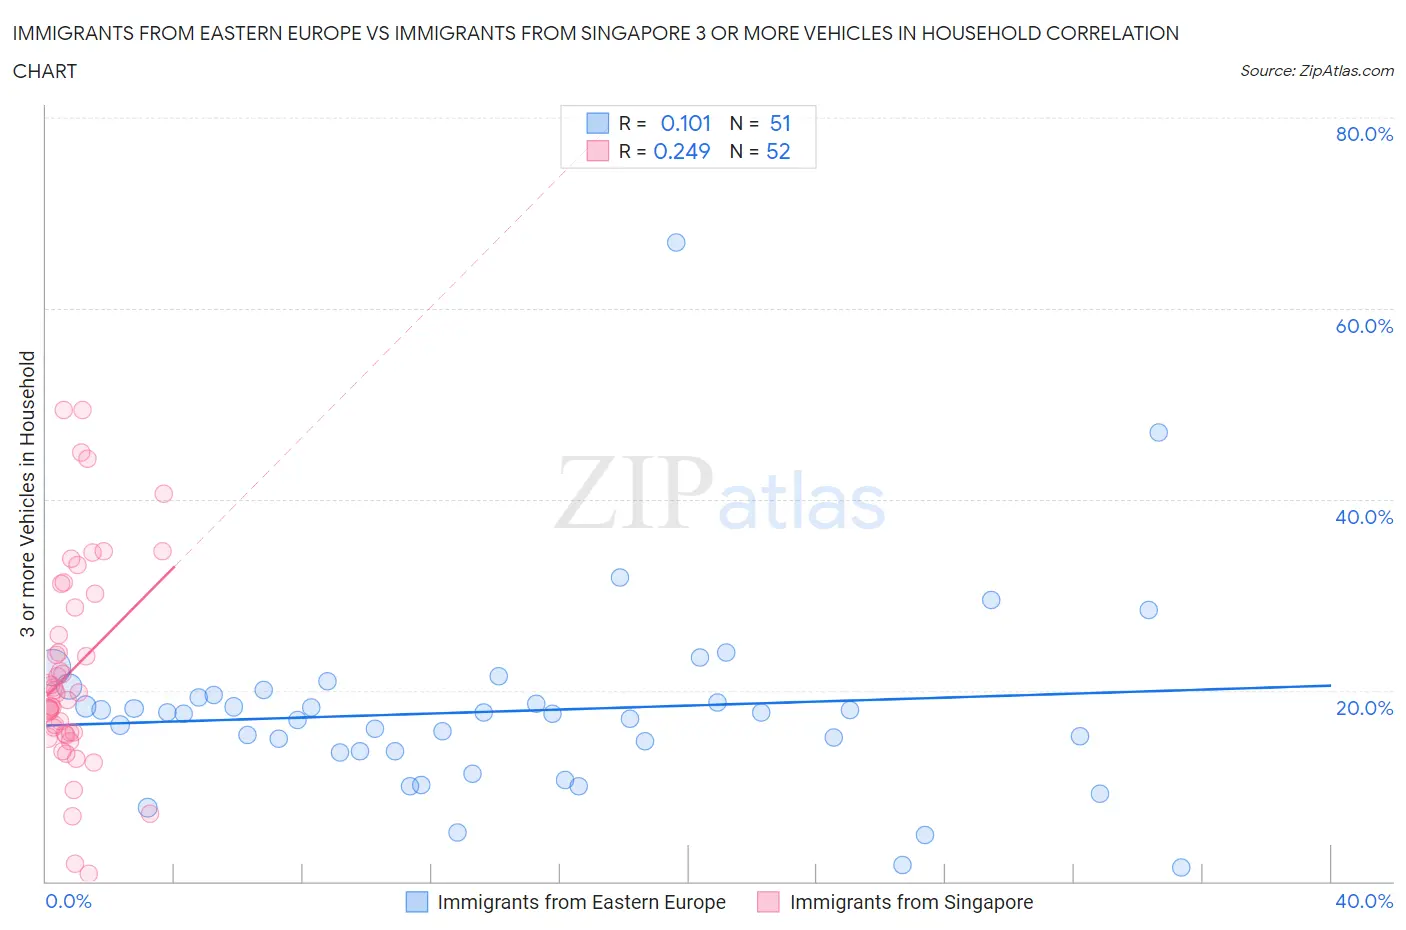
Immigrants from Eastern Europe vs Immigrants from Singapore 3 or more Vehicles in Household Correlation Chart
The statistical analysis conducted on geographies consisting of 475,306,541 people shows a poor positive correlation between the proportion of Immigrants from Eastern Europe and percentage of households with 3 or more vehicles available in the United States with a correlation coefficient (R) of 0.101 and weighted average of 17.4%. Similarly, the statistical analysis conducted on geographies consisting of 137,391,335 people shows a weak positive correlation between the proportion of Immigrants from Singapore and percentage of households with 3 or more vehicles available in the United States with a correlation coefficient (R) of 0.249 and weighted average of 18.4%, a difference of 6.0%.
3 or more Vehicles in Household Correlation Summary
| Measurement | Immigrants from Eastern Europe | Immigrants from Singapore |
| Minimum | 1.4% | 0.75% |
| Maximum | 66.9% | 49.4% |
| Range | 65.5% | 48.7% |
| Mean | 17.8% | 22.1% |
| Median | 17.6% | 19.7% |
| Interquartile 25% (IQ1) | 13.6% | 15.5% |
| Interquartile 75% (IQ3) | 19.5% | 29.4% |
| Interquartile Range (IQR) | 5.9% | 13.9% |
| Standard Deviation (Sample) | 10.3% | 11.0% |
| Standard Deviation (Population) | 10.2% | 10.9% |
Similar Demographics by 3 or more Vehicles in Household
Demographics Similar to Immigrants from Eastern Europe by 3 or more Vehicles in Household
In terms of 3 or more vehicles in household, the demographic groups most similar to Immigrants from Eastern Europe are Immigrants from Kazakhstan (17.4%, a difference of 0.040%), Immigrants from Latvia (17.4%, a difference of 0.040%), Immigrants from Bahamas (17.4%, a difference of 0.050%), Brazilian (17.4%, a difference of 0.14%), and Okinawan (17.4%, a difference of 0.29%).
| Demographics | Rating | Rank | 3 or more Vehicles in Household |
| Immigrants | Sudan | 0.5 /100 | #273 | Tragic 17.6% |
| Immigrants | Bosnia and Herzegovina | 0.5 /100 | #274 | Tragic 17.5% |
| Immigrants | Ukraine | 0.4 /100 | #275 | Tragic 17.5% |
| Okinawans | 0.4 /100 | #276 | Tragic 17.4% |
| Brazilians | 0.4 /100 | #277 | Tragic 17.4% |
| Immigrants | Bahamas | 0.3 /100 | #278 | Tragic 17.4% |
| Immigrants | Kazakhstan | 0.3 /100 | #279 | Tragic 17.4% |
| Immigrants | Eastern Europe | 0.3 /100 | #280 | Tragic 17.4% |
| Immigrants | Latvia | 0.3 /100 | #281 | Tragic 17.4% |
| Immigrants | Ireland | 0.3 /100 | #282 | Tragic 17.3% |
| Blacks/African Americans | 0.3 /100 | #283 | Tragic 17.3% |
| Immigrants | Colombia | 0.3 /100 | #284 | Tragic 17.3% |
| Immigrants | Croatia | 0.2 /100 | #285 | Tragic 17.2% |
| Menominee | 0.2 /100 | #286 | Tragic 17.2% |
| Immigrants | Brazil | 0.2 /100 | #287 | Tragic 17.1% |
Demographics Similar to Immigrants from Singapore by 3 or more Vehicles in Household
In terms of 3 or more vehicles in household, the demographic groups most similar to Immigrants from Singapore are Turkish (18.4%, a difference of 0.020%), Immigrants from Hungary (18.5%, a difference of 0.030%), Immigrants from Lithuania (18.5%, a difference of 0.060%), Immigrants from Argentina (18.5%, a difference of 0.070%), and Immigrants from Czechoslovakia (18.5%, a difference of 0.17%).
| Demographics | Rating | Rank | 3 or more Vehicles in Household |
| Nigerians | 7.9 /100 | #220 | Tragic 18.6% |
| Immigrants | Poland | 7.5 /100 | #221 | Tragic 18.6% |
| Belizeans | 7.3 /100 | #222 | Tragic 18.6% |
| Immigrants | Czechoslovakia | 5.9 /100 | #223 | Tragic 18.5% |
| Immigrants | Argentina | 5.6 /100 | #224 | Tragic 18.5% |
| Immigrants | Lithuania | 5.6 /100 | #225 | Tragic 18.5% |
| Immigrants | Hungary | 5.5 /100 | #226 | Tragic 18.5% |
| Immigrants | Singapore | 5.4 /100 | #227 | Tragic 18.4% |
| Turks | 5.4 /100 | #228 | Tragic 18.4% |
| Immigrants | Switzerland | 5.0 /100 | #229 | Tragic 18.4% |
| Immigrants | Western Asia | 4.8 /100 | #230 | Tragic 18.4% |
| Immigrants | Belgium | 4.8 /100 | #231 | Tragic 18.4% |
| Immigrants | Uganda | 4.6 /100 | #232 | Tragic 18.4% |
| Hondurans | 4.6 /100 | #233 | Tragic 18.4% |
| Immigrants | North Macedonia | 4.4 /100 | #234 | Tragic 18.4% |