Guamanian/Chamorro vs Immigrants from Sudan No Vehicles in Household
COMPARE
Guamanian/Chamorro
Immigrants from Sudan
No Vehicles in Household
No Vehicles in Household Comparison
Guamanians/Chamorros
Immigrants from Sudan
8.0%
NO VEHICLES IN HOUSEHOLD
99.9/ 100
METRIC RATING
49th/ 347
METRIC RANK
10.4%
NO VEHICLES IN HOUSEHOLD
50.0/ 100
METRIC RATING
174th/ 347
METRIC RANK
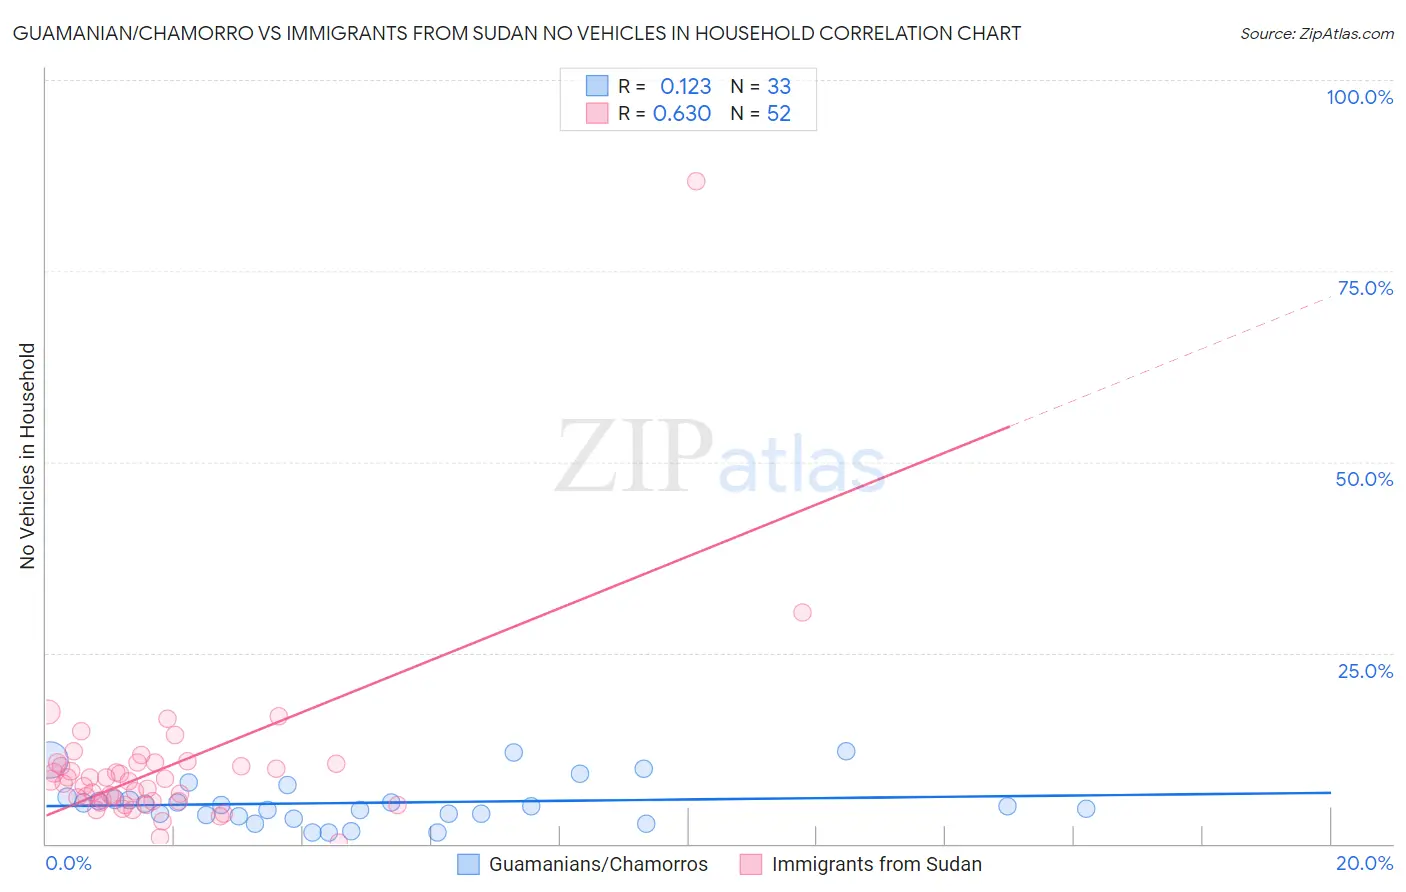
Guamanian/Chamorro vs Immigrants from Sudan No Vehicles in Household Correlation Chart
The statistical analysis conducted on geographies consisting of 221,696,459 people shows a poor positive correlation between the proportion of Guamanians/Chamorros and percentage of households with no vehicle available in the United States with a correlation coefficient (R) of 0.123 and weighted average of 8.0%. Similarly, the statistical analysis conducted on geographies consisting of 118,914,710 people shows a significant positive correlation between the proportion of Immigrants from Sudan and percentage of households with no vehicle available in the United States with a correlation coefficient (R) of 0.630 and weighted average of 10.4%, a difference of 30.4%.
No Vehicles in Household Correlation Summary
| Measurement | Guamanian/Chamorro | Immigrants from Sudan |
| Minimum | 1.4% | 0.089% |
| Maximum | 12.1% | 86.7% |
| Range | 10.7% | 86.6% |
| Mean | 5.4% | 10.0% |
| Median | 5.0% | 8.3% |
| Interquartile 25% (IQ1) | 3.7% | 5.6% |
| Interquartile 75% (IQ3) | 6.0% | 10.5% |
| Interquartile Range (IQR) | 2.3% | 5.0% |
| Standard Deviation (Sample) | 2.9% | 11.8% |
| Standard Deviation (Population) | 2.8% | 11.7% |
Similar Demographics by No Vehicles in Household
Demographics Similar to Guamanians/Chamorros by No Vehicles in Household
In terms of no vehicles in household, the demographic groups most similar to Guamanians/Chamorros are Belgian (8.0%, a difference of 0.070%), Afghan (8.0%, a difference of 0.17%), Korean (8.0%, a difference of 0.17%), Northern European (7.9%, a difference of 0.65%), and Hawaiian (8.0%, a difference of 0.75%).
| Demographics | Rating | Rank | No Vehicles in Household |
| Swiss | 99.9 /100 | #42 | Exceptional 7.9% |
| Chickasaw | 99.9 /100 | #43 | Exceptional 7.9% |
| Choctaw | 99.9 /100 | #44 | Exceptional 7.9% |
| Immigrants | Nonimmigrants | 99.9 /100 | #45 | Exceptional 7.9% |
| Spanish | 99.9 /100 | #46 | Exceptional 7.9% |
| Northern Europeans | 99.9 /100 | #47 | Exceptional 7.9% |
| Afghans | 99.9 /100 | #48 | Exceptional 8.0% |
| Guamanians/Chamorros | 99.9 /100 | #49 | Exceptional 8.0% |
| Belgians | 99.9 /100 | #50 | Exceptional 8.0% |
| Koreans | 99.9 /100 | #51 | Exceptional 8.0% |
| Hawaiians | 99.9 /100 | #52 | Exceptional 8.0% |
| Slovenes | 99.9 /100 | #53 | Exceptional 8.0% |
| Immigrants | Venezuela | 99.9 /100 | #54 | Exceptional 8.1% |
| Celtics | 99.9 /100 | #55 | Exceptional 8.1% |
| Immigrants | Afghanistan | 99.9 /100 | #56 | Exceptional 8.1% |
Demographics Similar to Immigrants from Sudan by No Vehicles in Household
In terms of no vehicles in household, the demographic groups most similar to Immigrants from Sudan are Filipino (10.4%, a difference of 0.010%), Immigrants from Burma/Myanmar (10.4%, a difference of 0.12%), French American Indian (10.4%, a difference of 0.12%), Immigrants from El Salvador (10.4%, a difference of 0.13%), and Brazilian (10.4%, a difference of 0.23%).
| Demographics | Rating | Rank | No Vehicles in Household |
| Immigrants | Saudi Arabia | 58.8 /100 | #167 | Average 10.3% |
| Indonesians | 56.7 /100 | #168 | Average 10.3% |
| Lumbee | 54.7 /100 | #169 | Average 10.3% |
| Immigrants | Latin America | 53.2 /100 | #170 | Average 10.4% |
| Hmong | 52.7 /100 | #171 | Average 10.4% |
| Brazilians | 51.7 /100 | #172 | Average 10.4% |
| Filipinos | 50.1 /100 | #173 | Average 10.4% |
| Immigrants | Sudan | 50.0 /100 | #174 | Average 10.4% |
| Immigrants | Burma/Myanmar | 49.1 /100 | #175 | Average 10.4% |
| French American Indians | 49.1 /100 | #176 | Average 10.4% |
| Immigrants | El Salvador | 49.1 /100 | #177 | Average 10.4% |
| Immigrants | Ethiopia | 48.0 /100 | #178 | Average 10.4% |
| Ethiopians | 45.8 /100 | #179 | Average 10.5% |
| Arabs | 45.3 /100 | #180 | Average 10.5% |
| Immigrants | Colombia | 44.1 /100 | #181 | Average 10.5% |