Guamanian/Chamorro vs Somali No Vehicles in Household
COMPARE
Guamanian/Chamorro
Somali
No Vehicles in Household
No Vehicles in Household Comparison
Guamanians/Chamorros
Somalis
8.0%
NO VEHICLES IN HOUSEHOLD
99.9/ 100
METRIC RATING
49th/ 347
METRIC RANK
11.0%
NO VEHICLES IN HOUSEHOLD
15.9/ 100
METRIC RATING
206th/ 347
METRIC RANK
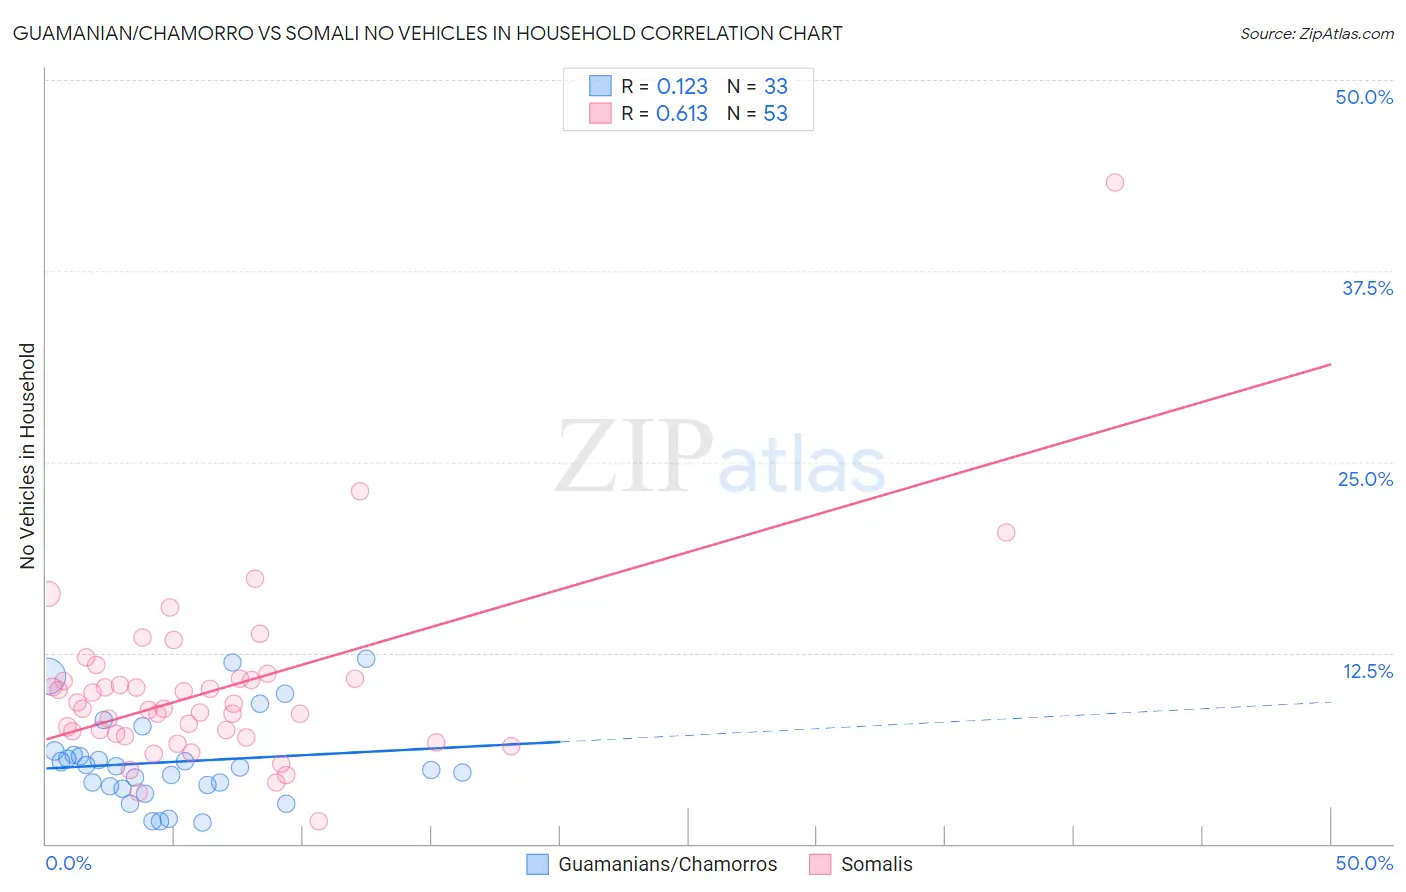
Guamanian/Chamorro vs Somali No Vehicles in Household Correlation Chart
The statistical analysis conducted on geographies consisting of 221,696,459 people shows a poor positive correlation between the proportion of Guamanians/Chamorros and percentage of households with no vehicle available in the United States with a correlation coefficient (R) of 0.123 and weighted average of 8.0%. Similarly, the statistical analysis conducted on geographies consisting of 99,232,743 people shows a significant positive correlation between the proportion of Somalis and percentage of households with no vehicle available in the United States with a correlation coefficient (R) of 0.613 and weighted average of 11.0%, a difference of 37.7%.
No Vehicles in Household Correlation Summary
| Measurement | Guamanian/Chamorro | Somali |
| Minimum | 1.4% | 1.4% |
| Maximum | 12.1% | 43.3% |
| Range | 10.7% | 41.9% |
| Mean | 5.4% | 10.1% |
| Median | 5.0% | 8.8% |
| Interquartile 25% (IQ1) | 3.7% | 7.1% |
| Interquartile 75% (IQ3) | 6.0% | 10.8% |
| Interquartile Range (IQR) | 2.3% | 3.7% |
| Standard Deviation (Sample) | 2.9% | 6.1% |
| Standard Deviation (Population) | 2.8% | 6.0% |
Similar Demographics by No Vehicles in Household
Demographics Similar to Guamanians/Chamorros by No Vehicles in Household
In terms of no vehicles in household, the demographic groups most similar to Guamanians/Chamorros are Belgian (8.0%, a difference of 0.070%), Afghan (8.0%, a difference of 0.17%), Korean (8.0%, a difference of 0.17%), Northern European (7.9%, a difference of 0.65%), and Hawaiian (8.0%, a difference of 0.75%).
| Demographics | Rating | Rank | No Vehicles in Household |
| Swiss | 99.9 /100 | #42 | Exceptional 7.9% |
| Chickasaw | 99.9 /100 | #43 | Exceptional 7.9% |
| Choctaw | 99.9 /100 | #44 | Exceptional 7.9% |
| Immigrants | Nonimmigrants | 99.9 /100 | #45 | Exceptional 7.9% |
| Spanish | 99.9 /100 | #46 | Exceptional 7.9% |
| Northern Europeans | 99.9 /100 | #47 | Exceptional 7.9% |
| Afghans | 99.9 /100 | #48 | Exceptional 8.0% |
| Guamanians/Chamorros | 99.9 /100 | #49 | Exceptional 8.0% |
| Belgians | 99.9 /100 | #50 | Exceptional 8.0% |
| Koreans | 99.9 /100 | #51 | Exceptional 8.0% |
| Hawaiians | 99.9 /100 | #52 | Exceptional 8.0% |
| Slovenes | 99.9 /100 | #53 | Exceptional 8.0% |
| Immigrants | Venezuela | 99.9 /100 | #54 | Exceptional 8.1% |
| Celtics | 99.9 /100 | #55 | Exceptional 8.1% |
| Immigrants | Afghanistan | 99.9 /100 | #56 | Exceptional 8.1% |
Demographics Similar to Somalis by No Vehicles in Household
In terms of no vehicles in household, the demographic groups most similar to Somalis are Immigrants from Chile (11.0%, a difference of 0.0%), Guatemalan (11.0%, a difference of 0.050%), Sierra Leonean (11.0%, a difference of 0.050%), Immigrants from Italy (11.0%, a difference of 0.060%), and Pennsylvania German (11.0%, a difference of 0.10%).
| Demographics | Rating | Rank | No Vehicles in Household |
| Immigrants | Asia | 21.3 /100 | #199 | Fair 10.9% |
| Cambodians | 19.6 /100 | #200 | Poor 10.9% |
| Immigrants | Western Europe | 19.1 /100 | #201 | Poor 10.9% |
| Romanians | 17.9 /100 | #202 | Poor 10.9% |
| Iroquois | 17.6 /100 | #203 | Poor 10.9% |
| Guatemalans | 16.1 /100 | #204 | Poor 11.0% |
| Immigrants | Chile | 15.9 /100 | #205 | Poor 11.0% |
| Somalis | 15.9 /100 | #206 | Poor 11.0% |
| Sierra Leoneans | 15.7 /100 | #207 | Poor 11.0% |
| Immigrants | Italy | 15.6 /100 | #208 | Poor 11.0% |
| Pennsylvania Germans | 15.5 /100 | #209 | Poor 11.0% |
| Apache | 14.8 /100 | #210 | Poor 11.0% |
| Crow | 14.2 /100 | #211 | Poor 11.0% |
| Immigrants | Western Asia | 13.9 /100 | #212 | Poor 11.0% |
| Immigrants | Hungary | 12.3 /100 | #213 | Poor 11.1% |