Guamanian/Chamorro vs Immigrants from Sudan Single Male Poverty
COMPARE
Guamanian/Chamorro
Immigrants from Sudan
Single Male Poverty
Single Male Poverty Comparison
Guamanians/Chamorros
Immigrants from Sudan
12.2%
SINGLE MALE POVERTY
97.4/ 100
METRIC RATING
98th/ 347
METRIC RANK
12.7%
SINGLE MALE POVERTY
58.2/ 100
METRIC RATING
167th/ 347
METRIC RANK
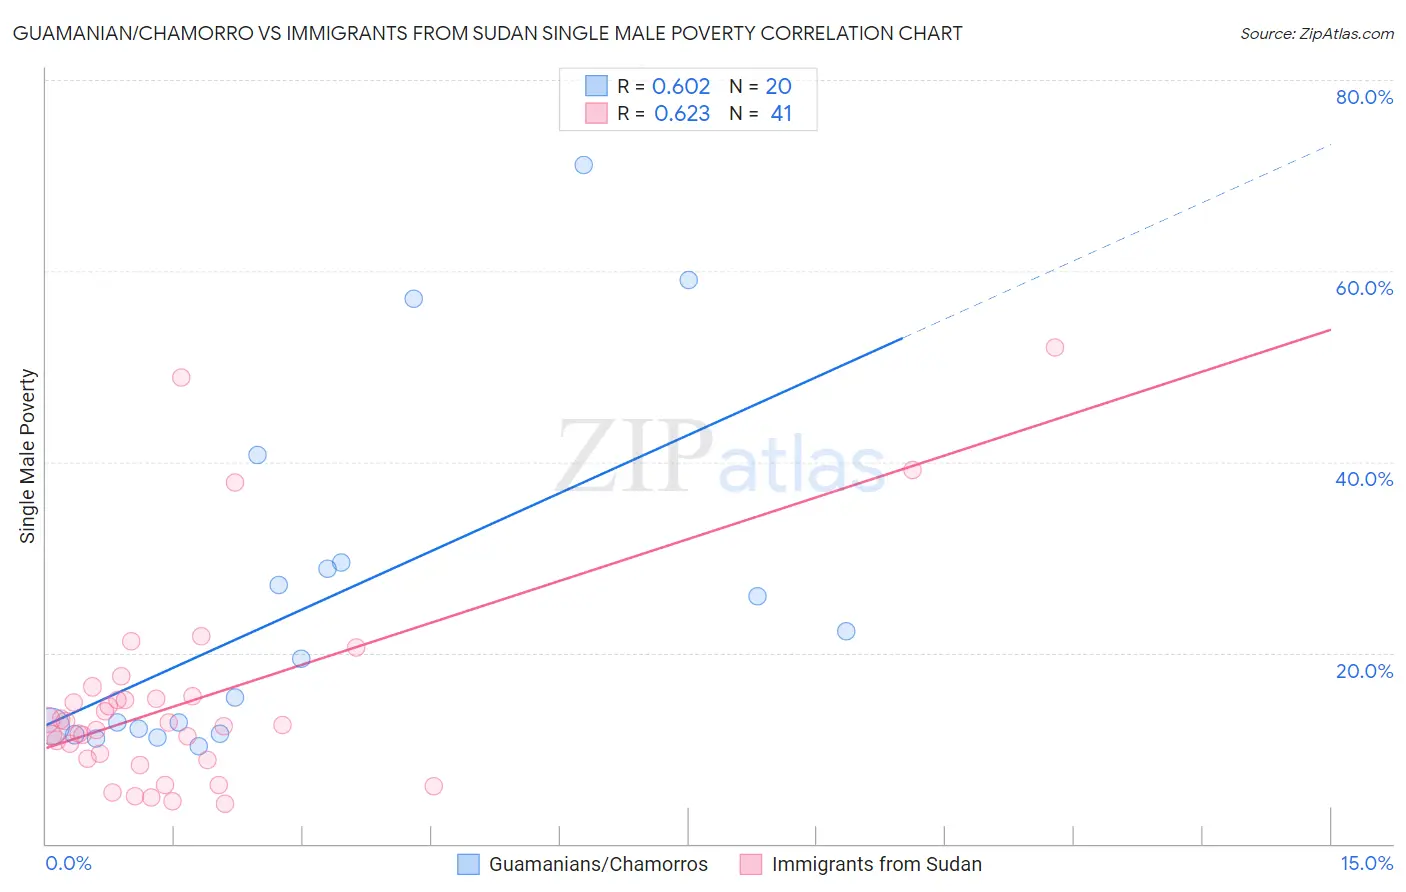
Guamanian/Chamorro vs Immigrants from Sudan Single Male Poverty Correlation Chart
The statistical analysis conducted on geographies consisting of 207,536,153 people shows a significant positive correlation between the proportion of Guamanians/Chamorros and poverty level among single males in the United States with a correlation coefficient (R) of 0.602 and weighted average of 12.2%. Similarly, the statistical analysis conducted on geographies consisting of 114,680,115 people shows a significant positive correlation between the proportion of Immigrants from Sudan and poverty level among single males in the United States with a correlation coefficient (R) of 0.623 and weighted average of 12.7%, a difference of 4.6%.
Single Male Poverty Correlation Summary
| Measurement | Guamanian/Chamorro | Immigrants from Sudan |
| Minimum | 10.2% | 4.2% |
| Maximum | 71.1% | 52.0% |
| Range | 60.8% | 47.8% |
| Mean | 25.1% | 14.9% |
| Median | 17.3% | 12.5% |
| Interquartile 25% (IQ1) | 11.8% | 8.9% |
| Interquartile 75% (IQ3) | 29.1% | 15.4% |
| Interquartile Range (IQR) | 17.3% | 6.5% |
| Standard Deviation (Sample) | 18.3% | 10.9% |
| Standard Deviation (Population) | 17.8% | 10.8% |
Similar Demographics by Single Male Poverty
Demographics Similar to Guamanians/Chamorros by Single Male Poverty
In terms of single male poverty, the demographic groups most similar to Guamanians/Chamorros are Immigrants from Italy (12.2%, a difference of 0.0%), Immigrants from Cuba (12.2%, a difference of 0.040%), Immigrants from Sweden (12.2%, a difference of 0.050%), Immigrants from Australia (12.2%, a difference of 0.15%), and Immigrants from Latvia (12.2%, a difference of 0.19%).
| Demographics | Rating | Rank | Single Male Poverty |
| Immigrants | Turkey | 98.2 /100 | #91 | Exceptional 12.1% |
| Spanish American Indians | 98.0 /100 | #92 | Exceptional 12.1% |
| Immigrants | Bosnia and Herzegovina | 97.9 /100 | #93 | Exceptional 12.1% |
| Colombians | 97.8 /100 | #94 | Exceptional 12.2% |
| Mongolians | 97.7 /100 | #95 | Exceptional 12.2% |
| Immigrants | Sweden | 97.5 /100 | #96 | Exceptional 12.2% |
| Immigrants | Italy | 97.4 /100 | #97 | Exceptional 12.2% |
| Guamanians/Chamorros | 97.4 /100 | #98 | Exceptional 12.2% |
| Immigrants | Cuba | 97.3 /100 | #99 | Exceptional 12.2% |
| Immigrants | Australia | 97.1 /100 | #100 | Exceptional 12.2% |
| Immigrants | Latvia | 97.0 /100 | #101 | Exceptional 12.2% |
| Immigrants | Europe | 97.0 /100 | #102 | Exceptional 12.2% |
| Immigrants | Armenia | 96.7 /100 | #103 | Exceptional 12.2% |
| Immigrants | Kazakhstan | 96.7 /100 | #104 | Exceptional 12.2% |
| Jordanians | 95.9 /100 | #105 | Exceptional 12.3% |
Demographics Similar to Immigrants from Sudan by Single Male Poverty
In terms of single male poverty, the demographic groups most similar to Immigrants from Sudan are Immigrants from Barbados (12.7%, a difference of 0.030%), Immigrants from Guyana (12.7%, a difference of 0.13%), Puget Sound Salish (12.8%, a difference of 0.21%), Immigrants from Cambodia (12.7%, a difference of 0.22%), and Immigrants from Nigeria (12.7%, a difference of 0.26%).
| Demographics | Rating | Rank | Single Male Poverty |
| Greeks | 64.1 /100 | #160 | Good 12.7% |
| Immigrants | Africa | 63.4 /100 | #161 | Good 12.7% |
| Eastern Europeans | 63.3 /100 | #162 | Good 12.7% |
| Palestinians | 63.1 /100 | #163 | Good 12.7% |
| Immigrants | Nigeria | 62.8 /100 | #164 | Good 12.7% |
| Immigrants | Cambodia | 62.2 /100 | #165 | Good 12.7% |
| Immigrants | Guyana | 60.5 /100 | #166 | Good 12.7% |
| Immigrants | Sudan | 58.2 /100 | #167 | Average 12.7% |
| Immigrants | Barbados | 57.7 /100 | #168 | Average 12.7% |
| Puget Sound Salish | 54.3 /100 | #169 | Average 12.8% |
| Guyanese | 52.0 /100 | #170 | Average 12.8% |
| South Africans | 51.5 /100 | #171 | Average 12.8% |
| Danes | 51.4 /100 | #172 | Average 12.8% |
| Immigrants | St. Vincent and the Grenadines | 50.9 /100 | #173 | Average 12.8% |
| Costa Ricans | 50.0 /100 | #174 | Average 12.8% |