Guamanian/Chamorro vs Central American No Vehicles in Household
COMPARE
Guamanian/Chamorro
Central American
No Vehicles in Household
No Vehicles in Household Comparison
Guamanians/Chamorros
Central Americans
8.0%
NO VEHICLES IN HOUSEHOLD
99.9/ 100
METRIC RATING
49th/ 347
METRIC RANK
10.8%
NO VEHICLES IN HOUSEHOLD
24.3/ 100
METRIC RATING
196th/ 347
METRIC RANK
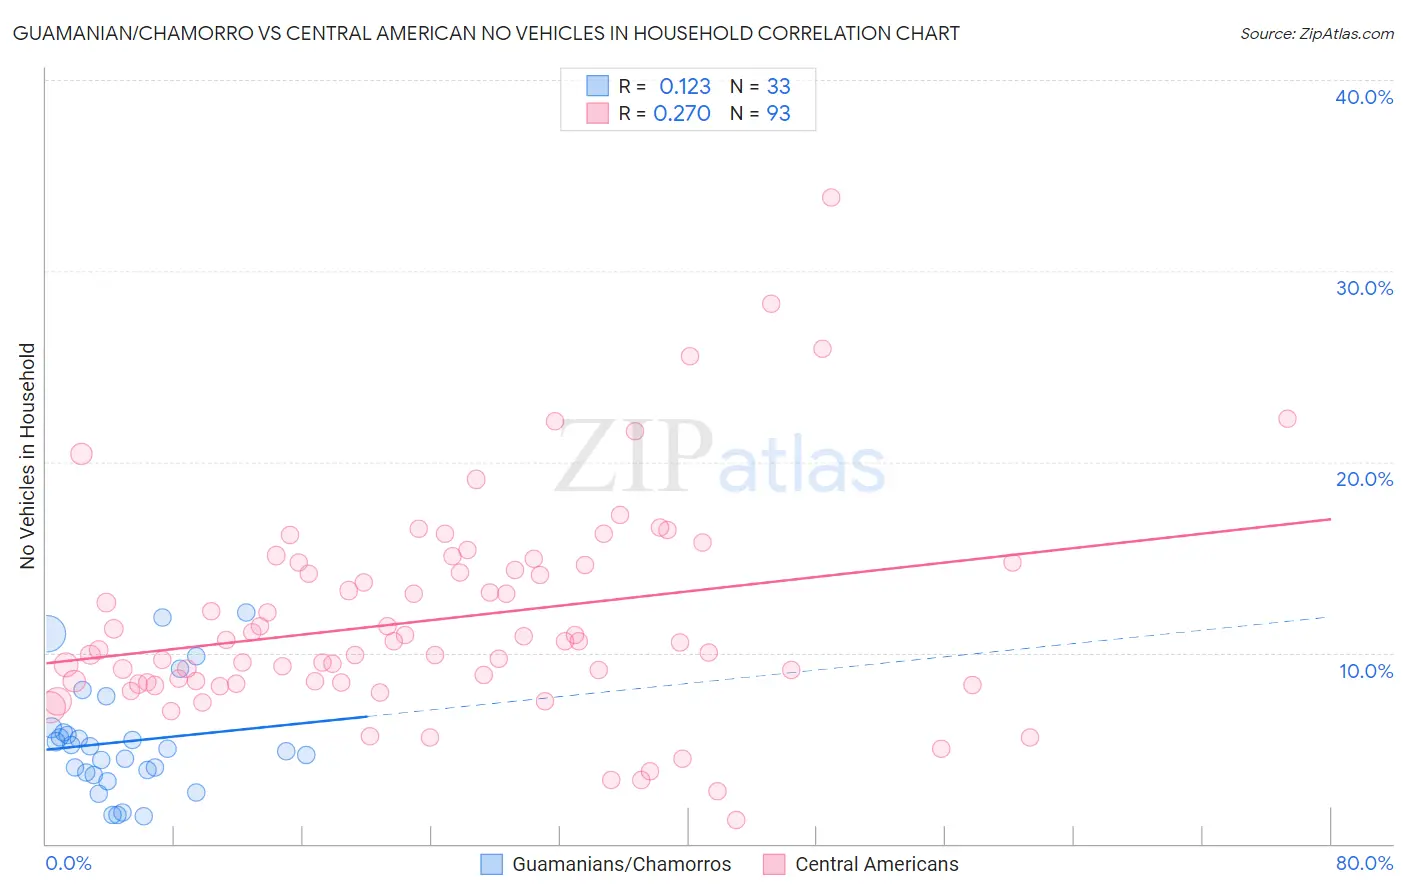
Guamanian/Chamorro vs Central American No Vehicles in Household Correlation Chart
The statistical analysis conducted on geographies consisting of 221,696,459 people shows a poor positive correlation between the proportion of Guamanians/Chamorros and percentage of households with no vehicle available in the United States with a correlation coefficient (R) of 0.123 and weighted average of 8.0%. Similarly, the statistical analysis conducted on geographies consisting of 502,389,156 people shows a weak positive correlation between the proportion of Central Americans and percentage of households with no vehicle available in the United States with a correlation coefficient (R) of 0.270 and weighted average of 10.8%, a difference of 35.4%.
No Vehicles in Household Correlation Summary
| Measurement | Guamanian/Chamorro | Central American |
| Minimum | 1.4% | 1.3% |
| Maximum | 12.1% | 33.8% |
| Range | 10.7% | 32.6% |
| Mean | 5.4% | 11.8% |
| Median | 5.0% | 10.6% |
| Interquartile 25% (IQ1) | 3.7% | 8.4% |
| Interquartile 75% (IQ3) | 6.0% | 14.7% |
| Interquartile Range (IQR) | 2.3% | 6.2% |
| Standard Deviation (Sample) | 2.9% | 5.5% |
| Standard Deviation (Population) | 2.8% | 5.5% |
Similar Demographics by No Vehicles in Household
Demographics Similar to Guamanians/Chamorros by No Vehicles in Household
In terms of no vehicles in household, the demographic groups most similar to Guamanians/Chamorros are Belgian (8.0%, a difference of 0.070%), Afghan (8.0%, a difference of 0.17%), Korean (8.0%, a difference of 0.17%), Northern European (7.9%, a difference of 0.65%), and Hawaiian (8.0%, a difference of 0.75%).
| Demographics | Rating | Rank | No Vehicles in Household |
| Swiss | 99.9 /100 | #42 | Exceptional 7.9% |
| Chickasaw | 99.9 /100 | #43 | Exceptional 7.9% |
| Choctaw | 99.9 /100 | #44 | Exceptional 7.9% |
| Immigrants | Nonimmigrants | 99.9 /100 | #45 | Exceptional 7.9% |
| Spanish | 99.9 /100 | #46 | Exceptional 7.9% |
| Northern Europeans | 99.9 /100 | #47 | Exceptional 7.9% |
| Afghans | 99.9 /100 | #48 | Exceptional 8.0% |
| Guamanians/Chamorros | 99.9 /100 | #49 | Exceptional 8.0% |
| Belgians | 99.9 /100 | #50 | Exceptional 8.0% |
| Koreans | 99.9 /100 | #51 | Exceptional 8.0% |
| Hawaiians | 99.9 /100 | #52 | Exceptional 8.0% |
| Slovenes | 99.9 /100 | #53 | Exceptional 8.0% |
| Immigrants | Venezuela | 99.9 /100 | #54 | Exceptional 8.1% |
| Celtics | 99.9 /100 | #55 | Exceptional 8.1% |
| Immigrants | Afghanistan | 99.9 /100 | #56 | Exceptional 8.1% |
Demographics Similar to Central Americans by No Vehicles in Household
In terms of no vehicles in household, the demographic groups most similar to Central Americans are Shoshone (10.8%, a difference of 0.040%), Immigrants from Sweden (10.8%, a difference of 0.25%), Immigrants from Brazil (10.8%, a difference of 0.34%), Pueblo (10.8%, a difference of 0.45%), and Immigrants from Asia (10.9%, a difference of 0.56%).
| Demographics | Rating | Rank | No Vehicles in Household |
| Immigrants | Eritrea | 36.3 /100 | #189 | Fair 10.6% |
| Immigrants | North Macedonia | 34.6 /100 | #190 | Fair 10.6% |
| Immigrants | Northern Europe | 33.1 /100 | #191 | Fair 10.7% |
| Carpatho Rusyns | 32.1 /100 | #192 | Fair 10.7% |
| Ukrainians | 28.0 /100 | #193 | Fair 10.7% |
| Pueblo | 27.0 /100 | #194 | Fair 10.8% |
| Immigrants | Brazil | 26.3 /100 | #195 | Fair 10.8% |
| Central Americans | 24.3 /100 | #196 | Fair 10.8% |
| Shoshone | 24.1 /100 | #197 | Fair 10.8% |
| Immigrants | Sweden | 22.9 /100 | #198 | Fair 10.8% |
| Immigrants | Asia | 21.3 /100 | #199 | Fair 10.9% |
| Cambodians | 19.6 /100 | #200 | Poor 10.9% |
| Immigrants | Western Europe | 19.1 /100 | #201 | Poor 10.9% |
| Romanians | 17.9 /100 | #202 | Poor 10.9% |
| Iroquois | 17.6 /100 | #203 | Poor 10.9% |