Guamanian/Chamorro vs Liberian No Vehicles in Household
COMPARE
Guamanian/Chamorro
Liberian
No Vehicles in Household
No Vehicles in Household Comparison
Guamanians/Chamorros
Liberians
8.0%
NO VEHICLES IN HOUSEHOLD
99.9/ 100
METRIC RATING
49th/ 347
METRIC RANK
12.0%
NO VEHICLES IN HOUSEHOLD
1.2/ 100
METRIC RATING
256th/ 347
METRIC RANK
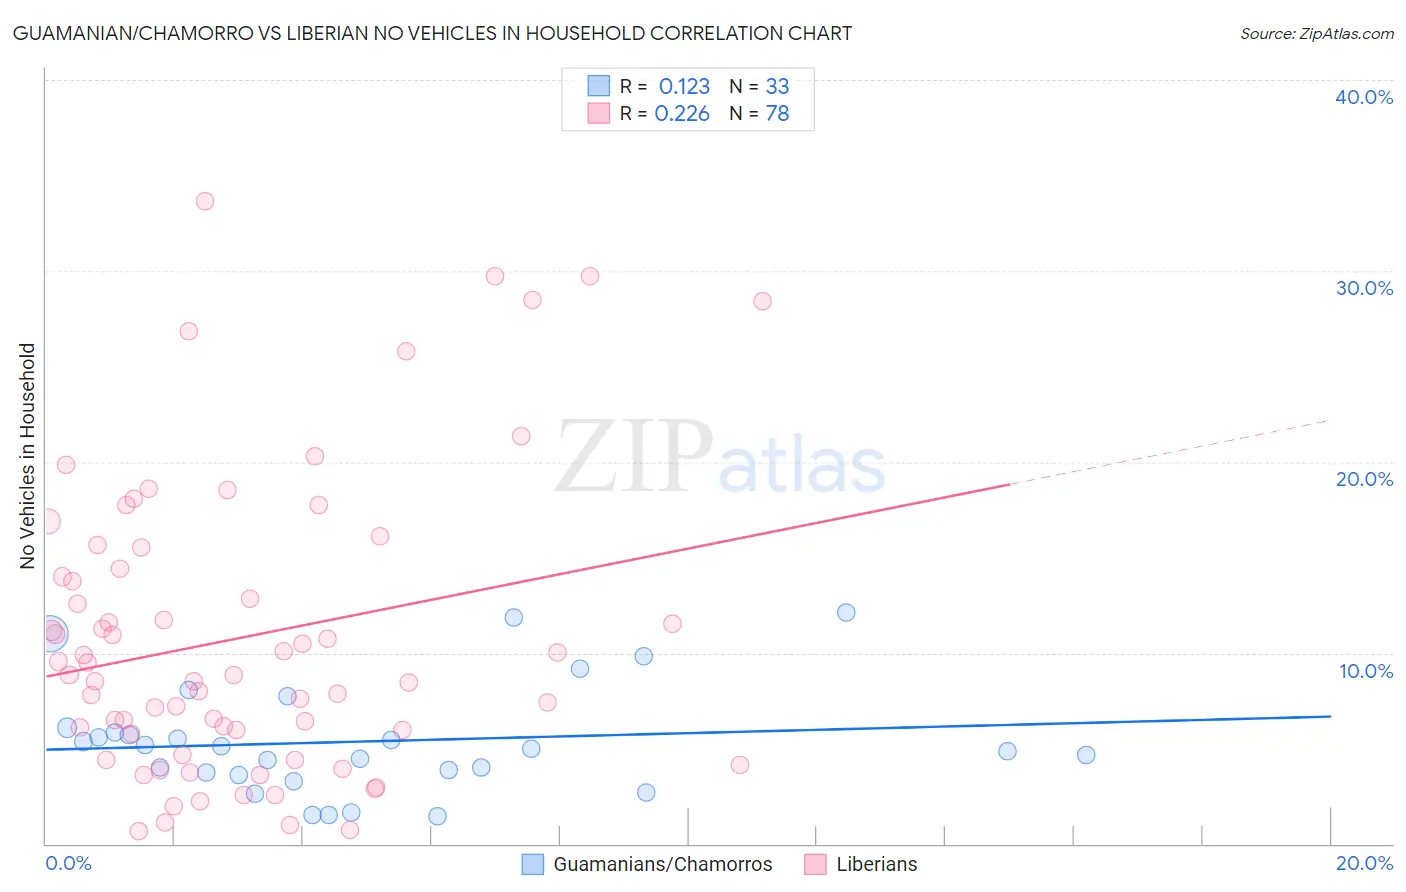
Guamanian/Chamorro vs Liberian No Vehicles in Household Correlation Chart
The statistical analysis conducted on geographies consisting of 221,696,459 people shows a poor positive correlation between the proportion of Guamanians/Chamorros and percentage of households with no vehicle available in the United States with a correlation coefficient (R) of 0.123 and weighted average of 8.0%. Similarly, the statistical analysis conducted on geographies consisting of 118,010,925 people shows a weak positive correlation between the proportion of Liberians and percentage of households with no vehicle available in the United States with a correlation coefficient (R) of 0.226 and weighted average of 12.0%, a difference of 50.0%.
No Vehicles in Household Correlation Summary
| Measurement | Guamanian/Chamorro | Liberian |
| Minimum | 1.4% | 0.64% |
| Maximum | 12.1% | 33.6% |
| Range | 10.7% | 33.0% |
| Mean | 5.4% | 10.8% |
| Median | 5.0% | 8.8% |
| Interquartile 25% (IQ1) | 3.7% | 5.7% |
| Interquartile 75% (IQ3) | 6.0% | 14.4% |
| Interquartile Range (IQR) | 2.3% | 8.7% |
| Standard Deviation (Sample) | 2.9% | 7.7% |
| Standard Deviation (Population) | 2.8% | 7.6% |
Similar Demographics by No Vehicles in Household
Demographics Similar to Guamanians/Chamorros by No Vehicles in Household
In terms of no vehicles in household, the demographic groups most similar to Guamanians/Chamorros are Belgian (8.0%, a difference of 0.070%), Afghan (8.0%, a difference of 0.17%), Korean (8.0%, a difference of 0.17%), Northern European (7.9%, a difference of 0.65%), and Hawaiian (8.0%, a difference of 0.75%).
| Demographics | Rating | Rank | No Vehicles in Household |
| Swiss | 99.9 /100 | #42 | Exceptional 7.9% |
| Chickasaw | 99.9 /100 | #43 | Exceptional 7.9% |
| Choctaw | 99.9 /100 | #44 | Exceptional 7.9% |
| Immigrants | Nonimmigrants | 99.9 /100 | #45 | Exceptional 7.9% |
| Spanish | 99.9 /100 | #46 | Exceptional 7.9% |
| Northern Europeans | 99.9 /100 | #47 | Exceptional 7.9% |
| Afghans | 99.9 /100 | #48 | Exceptional 8.0% |
| Guamanians/Chamorros | 99.9 /100 | #49 | Exceptional 8.0% |
| Belgians | 99.9 /100 | #50 | Exceptional 8.0% |
| Koreans | 99.9 /100 | #51 | Exceptional 8.0% |
| Hawaiians | 99.9 /100 | #52 | Exceptional 8.0% |
| Slovenes | 99.9 /100 | #53 | Exceptional 8.0% |
| Immigrants | Venezuela | 99.9 /100 | #54 | Exceptional 8.1% |
| Celtics | 99.9 /100 | #55 | Exceptional 8.1% |
| Immigrants | Afghanistan | 99.9 /100 | #56 | Exceptional 8.1% |
Demographics Similar to Liberians by No Vehicles in Household
In terms of no vehicles in household, the demographic groups most similar to Liberians are Honduran (12.0%, a difference of 0.050%), Immigrants from Uruguay (11.9%, a difference of 0.32%), Egyptian (11.9%, a difference of 0.64%), Immigrants from Serbia (11.9%, a difference of 0.71%), and Nigerian (12.1%, a difference of 0.74%).
| Demographics | Rating | Rank | No Vehicles in Household |
| Immigrants | Nigeria | 1.9 /100 | #249 | Tragic 11.8% |
| Paiute | 1.8 /100 | #250 | Tragic 11.8% |
| Blacks/African Americans | 1.6 /100 | #251 | Tragic 11.9% |
| Immigrants | Serbia | 1.5 /100 | #252 | Tragic 11.9% |
| Egyptians | 1.4 /100 | #253 | Tragic 11.9% |
| Immigrants | Uruguay | 1.3 /100 | #254 | Tragic 11.9% |
| Hondurans | 1.2 /100 | #255 | Tragic 12.0% |
| Liberians | 1.2 /100 | #256 | Tragic 12.0% |
| Nigerians | 0.9 /100 | #257 | Tragic 12.1% |
| South American Indians | 0.9 /100 | #258 | Tragic 12.1% |
| Immigrants | Latvia | 0.8 /100 | #259 | Tragic 12.1% |
| Macedonians | 0.7 /100 | #260 | Tragic 12.2% |
| Sub-Saharan Africans | 0.6 /100 | #261 | Tragic 12.2% |
| Immigrants | Liberia | 0.6 /100 | #262 | Tragic 12.2% |
| Immigrants | Egypt | 0.6 /100 | #263 | Tragic 12.2% |