Guamanian/Chamorro vs Immigrants from Philippines No Vehicles in Household
COMPARE
Guamanian/Chamorro
Immigrants from Philippines
No Vehicles in Household
No Vehicles in Household Comparison
Guamanians/Chamorros
Immigrants from Philippines
8.0%
NO VEHICLES IN HOUSEHOLD
99.9/ 100
METRIC RATING
49th/ 347
METRIC RANK
8.5%
NO VEHICLES IN HOUSEHOLD
99.5/ 100
METRIC RATING
76th/ 347
METRIC RANK
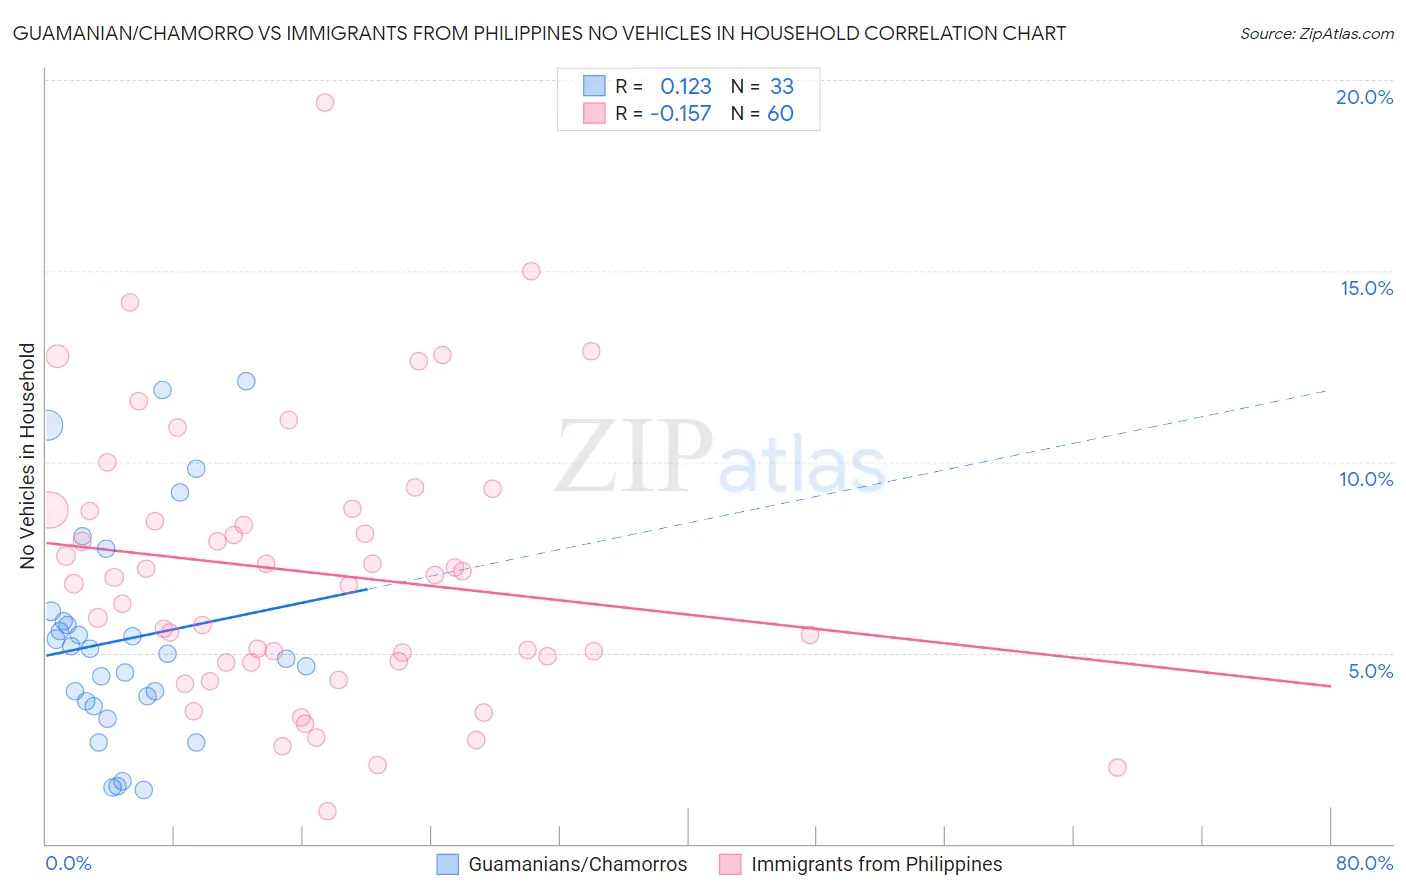
Guamanian/Chamorro vs Immigrants from Philippines No Vehicles in Household Correlation Chart
The statistical analysis conducted on geographies consisting of 221,696,459 people shows a poor positive correlation between the proportion of Guamanians/Chamorros and percentage of households with no vehicle available in the United States with a correlation coefficient (R) of 0.123 and weighted average of 8.0%. Similarly, the statistical analysis conducted on geographies consisting of 469,724,480 people shows a poor negative correlation between the proportion of Immigrants from Philippines and percentage of households with no vehicle available in the United States with a correlation coefficient (R) of -0.157 and weighted average of 8.5%, a difference of 7.1%.
No Vehicles in Household Correlation Summary
| Measurement | Guamanian/Chamorro | Immigrants from Philippines |
| Minimum | 1.4% | 0.84% |
| Maximum | 12.1% | 19.4% |
| Range | 10.7% | 18.6% |
| Mean | 5.4% | 7.1% |
| Median | 5.0% | 6.9% |
| Interquartile 25% (IQ1) | 3.7% | 4.8% |
| Interquartile 75% (IQ3) | 6.0% | 8.7% |
| Interquartile Range (IQR) | 2.3% | 4.0% |
| Standard Deviation (Sample) | 2.9% | 3.6% |
| Standard Deviation (Population) | 2.8% | 3.6% |
Similar Demographics by No Vehicles in Household
Demographics Similar to Guamanians/Chamorros by No Vehicles in Household
In terms of no vehicles in household, the demographic groups most similar to Guamanians/Chamorros are Belgian (8.0%, a difference of 0.070%), Afghan (8.0%, a difference of 0.17%), Korean (8.0%, a difference of 0.17%), Northern European (7.9%, a difference of 0.65%), and Hawaiian (8.0%, a difference of 0.75%).
| Demographics | Rating | Rank | No Vehicles in Household |
| Swiss | 99.9 /100 | #42 | Exceptional 7.9% |
| Chickasaw | 99.9 /100 | #43 | Exceptional 7.9% |
| Choctaw | 99.9 /100 | #44 | Exceptional 7.9% |
| Immigrants | Nonimmigrants | 99.9 /100 | #45 | Exceptional 7.9% |
| Spanish | 99.9 /100 | #46 | Exceptional 7.9% |
| Northern Europeans | 99.9 /100 | #47 | Exceptional 7.9% |
| Afghans | 99.9 /100 | #48 | Exceptional 8.0% |
| Guamanians/Chamorros | 99.9 /100 | #49 | Exceptional 8.0% |
| Belgians | 99.9 /100 | #50 | Exceptional 8.0% |
| Koreans | 99.9 /100 | #51 | Exceptional 8.0% |
| Hawaiians | 99.9 /100 | #52 | Exceptional 8.0% |
| Slovenes | 99.9 /100 | #53 | Exceptional 8.0% |
| Immigrants | Venezuela | 99.9 /100 | #54 | Exceptional 8.1% |
| Celtics | 99.9 /100 | #55 | Exceptional 8.1% |
| Immigrants | Afghanistan | 99.9 /100 | #56 | Exceptional 8.1% |
Demographics Similar to Immigrants from Philippines by No Vehicles in Household
In terms of no vehicles in household, the demographic groups most similar to Immigrants from Philippines are Iranian (8.6%, a difference of 0.090%), Immigrants from South Central Asia (8.6%, a difference of 0.21%), Jordanian (8.5%, a difference of 0.24%), Portuguese (8.6%, a difference of 0.26%), and Bolivian (8.6%, a difference of 0.41%).
| Demographics | Rating | Rank | No Vehicles in Household |
| Spaniards | 99.7 /100 | #69 | Exceptional 8.4% |
| Cajuns | 99.6 /100 | #70 | Exceptional 8.4% |
| Immigrants | Lebanon | 99.6 /100 | #71 | Exceptional 8.4% |
| Lithuanians | 99.6 /100 | #72 | Exceptional 8.4% |
| Poles | 99.6 /100 | #73 | Exceptional 8.4% |
| Cubans | 99.5 /100 | #74 | Exceptional 8.5% |
| Jordanians | 99.5 /100 | #75 | Exceptional 8.5% |
| Immigrants | Philippines | 99.5 /100 | #76 | Exceptional 8.5% |
| Iranians | 99.5 /100 | #77 | Exceptional 8.6% |
| Immigrants | South Central Asia | 99.5 /100 | #78 | Exceptional 8.6% |
| Portuguese | 99.5 /100 | #79 | Exceptional 8.6% |
| Bolivians | 99.4 /100 | #80 | Exceptional 8.6% |
| Tsimshian | 99.4 /100 | #81 | Exceptional 8.6% |
| Immigrants | South Eastern Asia | 99.4 /100 | #82 | Exceptional 8.6% |
| Italians | 99.4 /100 | #83 | Exceptional 8.6% |