Guamanian/Chamorro vs Immigrants from Sudan 12th Grade, No Diploma
COMPARE
Guamanian/Chamorro
Immigrants from Sudan
12th Grade, No Diploma
12th Grade, No Diploma Comparison
Guamanians/Chamorros
Immigrants from Sudan
91.0%
12TH GRADE, NO DIPLOMA
39.5/ 100
METRIC RATING
181st/ 347
METRIC RANK
90.8%
12TH GRADE, NO DIPLOMA
22.6/ 100
METRIC RATING
197th/ 347
METRIC RANK
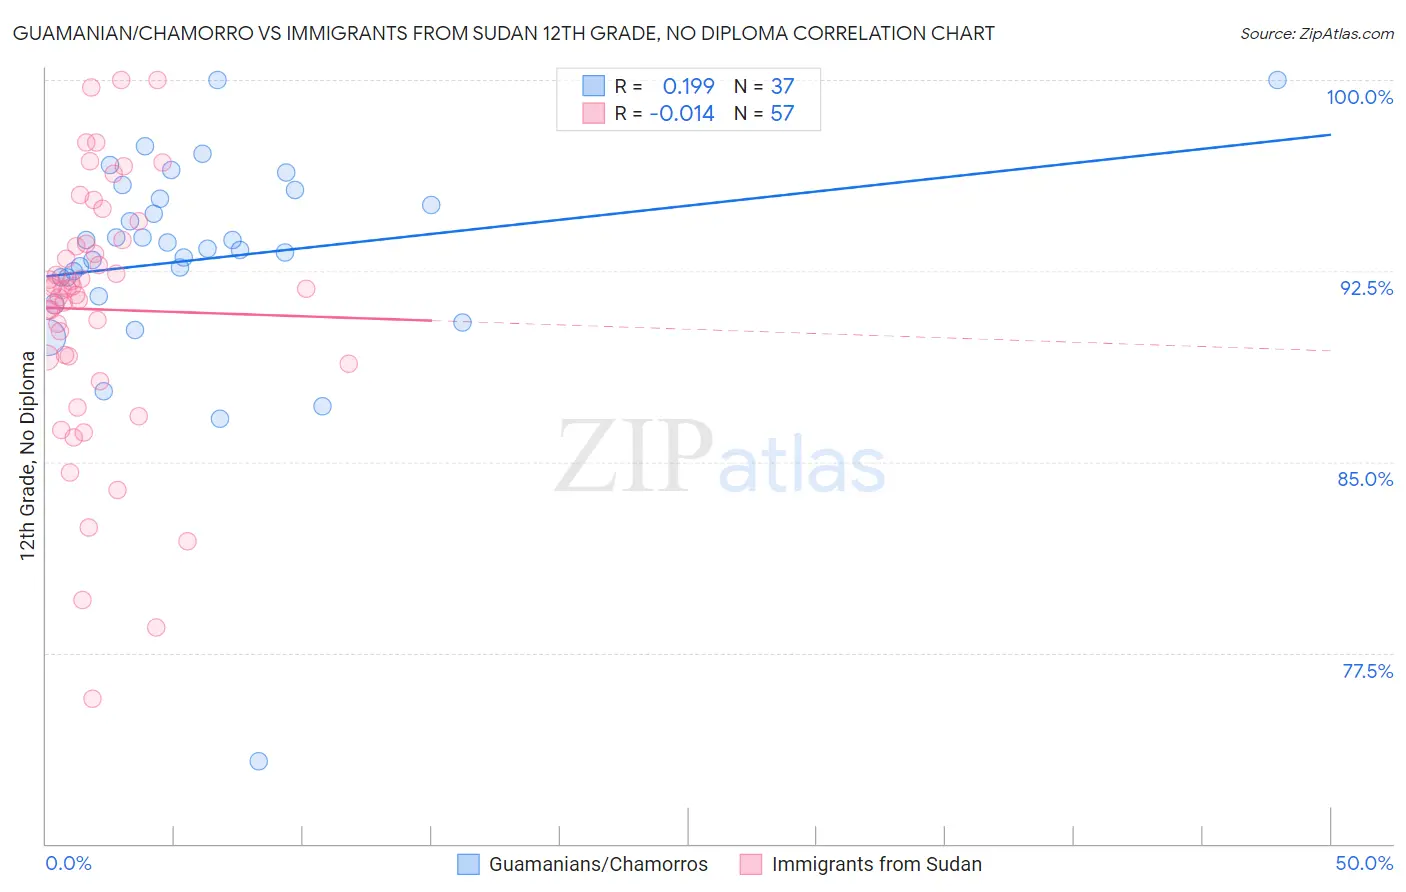
Guamanian/Chamorro vs Immigrants from Sudan 12th Grade, No Diploma Correlation Chart
The statistical analysis conducted on geographies consisting of 221,965,618 people shows a poor positive correlation between the proportion of Guamanians/Chamorros and percentage of population with at least 12th grade (no diploma) education in the United States with a correlation coefficient (R) of 0.199 and weighted average of 91.0%. Similarly, the statistical analysis conducted on geographies consisting of 118,959,807 people shows no correlation between the proportion of Immigrants from Sudan and percentage of population with at least 12th grade (no diploma) education in the United States with a correlation coefficient (R) of -0.014 and weighted average of 90.8%, a difference of 0.25%.
12th Grade, No Diploma Correlation Summary
| Measurement | Guamanian/Chamorro | Immigrants from Sudan |
| Minimum | 73.2% | 75.7% |
| Maximum | 100.0% | 100.0% |
| Range | 26.8% | 24.3% |
| Mean | 93.0% | 91.0% |
| Median | 93.4% | 91.8% |
| Interquartile 25% (IQ1) | 91.9% | 89.0% |
| Interquartile 75% (IQ3) | 95.5% | 93.7% |
| Interquartile Range (IQR) | 3.6% | 4.7% |
| Standard Deviation (Sample) | 4.5% | 5.1% |
| Standard Deviation (Population) | 4.4% | 5.1% |
Demographics Similar to Guamanians/Chamorros and Immigrants from Sudan by 12th Grade, No Diploma
In terms of 12th grade, no diploma, the demographic groups most similar to Guamanians/Chamorros are Immigrants from Syria (91.1%, a difference of 0.010%), Nonimmigrants (91.0%, a difference of 0.010%), Osage (91.0%, a difference of 0.020%), Spaniard (91.0%, a difference of 0.040%), and Immigrants from Chile (91.1%, a difference of 0.050%). Similarly, the demographic groups most similar to Immigrants from Sudan are Panamanian (90.8%, a difference of 0.0%), Korean (90.8%, a difference of 0.030%), Samoan (90.8%, a difference of 0.040%), Immigrants from Southern Europe (90.8%, a difference of 0.050%), and Immigrants from Oceania (90.9%, a difference of 0.060%).
| Demographics | Rating | Rank | 12th Grade, No Diploma |
| Immigrants | Chile | 43.3 /100 | #179 | Average 91.1% |
| Immigrants | Syria | 40.3 /100 | #180 | Average 91.1% |
| Guamanians/Chamorros | 39.5 /100 | #181 | Fair 91.0% |
| Immigrants | Nonimmigrants | 38.8 /100 | #182 | Fair 91.0% |
| Osage | 38.3 /100 | #183 | Fair 91.0% |
| Spaniards | 36.2 /100 | #184 | Fair 91.0% |
| Sudanese | 34.4 /100 | #185 | Fair 91.0% |
| Ethiopians | 33.9 /100 | #186 | Fair 91.0% |
| Potawatomi | 32.9 /100 | #187 | Fair 91.0% |
| Americans | 32.6 /100 | #188 | Fair 91.0% |
| Immigrants | Uganda | 31.6 /100 | #189 | Fair 90.9% |
| Afghans | 29.9 /100 | #190 | Fair 90.9% |
| Moroccans | 28.8 /100 | #191 | Fair 90.9% |
| Immigrants | Eastern Africa | 27.7 /100 | #192 | Fair 90.9% |
| Immigrants | Ethiopia | 27.2 /100 | #193 | Fair 90.9% |
| Immigrants | Oceania | 26.0 /100 | #194 | Fair 90.9% |
| Koreans | 24.5 /100 | #195 | Fair 90.8% |
| Panamanians | 22.8 /100 | #196 | Fair 90.8% |
| Immigrants | Sudan | 22.6 /100 | #197 | Fair 90.8% |
| Samoans | 20.4 /100 | #198 | Fair 90.8% |
| Immigrants | Southern Europe | 19.9 /100 | #199 | Poor 90.8% |