Guamanian/Chamorro vs English No Vehicles in Household
COMPARE
Guamanian/Chamorro
English
No Vehicles in Household
No Vehicles in Household Comparison
Guamanians/Chamorros
English
8.0%
NO VEHICLES IN HOUSEHOLD
99.9/ 100
METRIC RATING
49th/ 347
METRIC RANK
6.5%
NO VEHICLES IN HOUSEHOLD
100.0/ 100
METRIC RATING
3rd/ 347
METRIC RANK
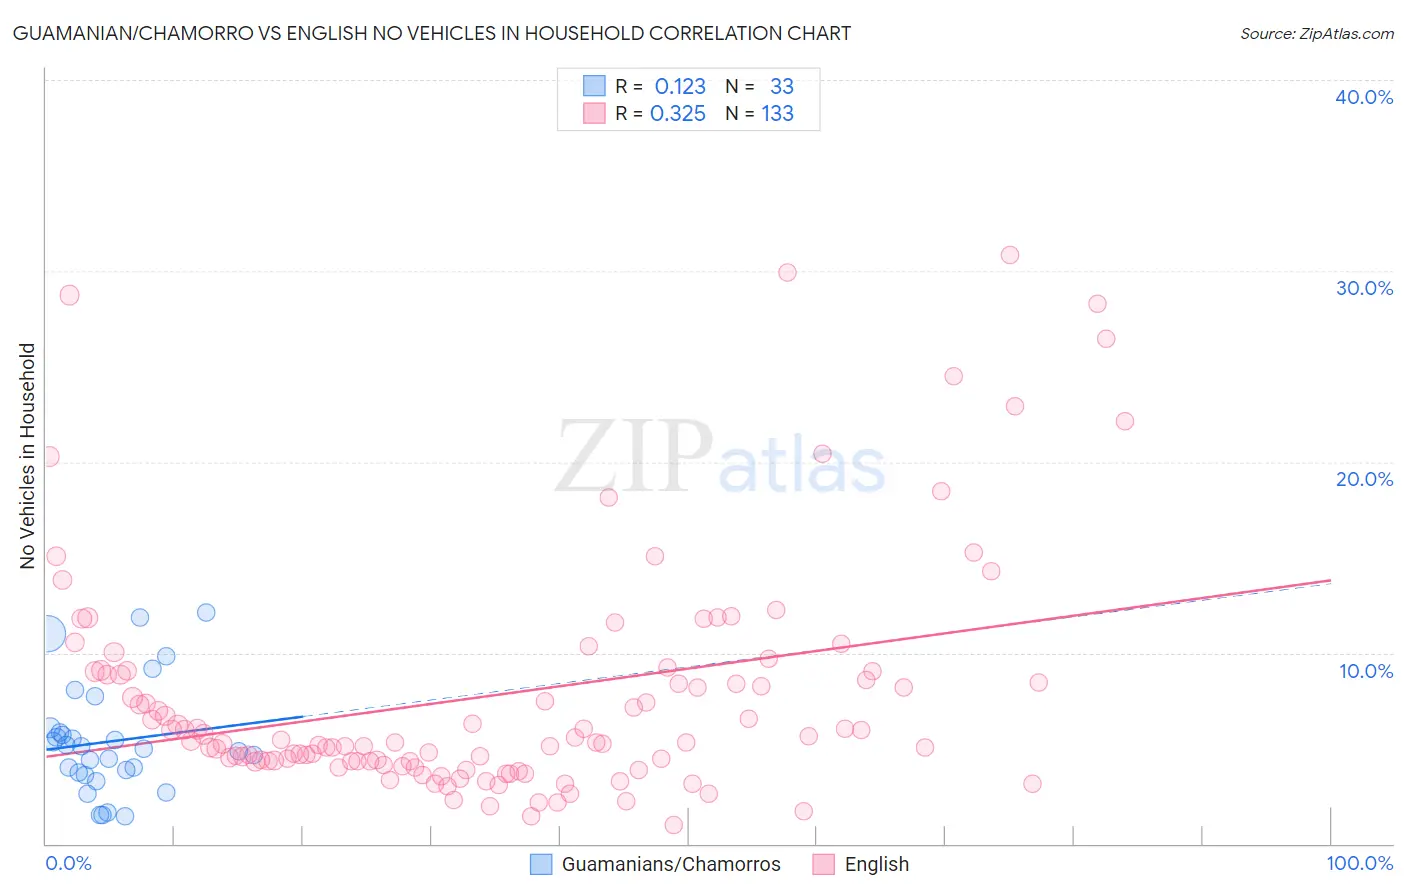
Guamanian/Chamorro vs English No Vehicles in Household Correlation Chart
The statistical analysis conducted on geographies consisting of 221,696,459 people shows a poor positive correlation between the proportion of Guamanians/Chamorros and percentage of households with no vehicle available in the United States with a correlation coefficient (R) of 0.123 and weighted average of 8.0%. Similarly, the statistical analysis conducted on geographies consisting of 572,648,684 people shows a mild positive correlation between the proportion of English and percentage of households with no vehicle available in the United States with a correlation coefficient (R) of 0.325 and weighted average of 6.5%, a difference of 22.6%.
No Vehicles in Household Correlation Summary
| Measurement | Guamanian/Chamorro | English |
| Minimum | 1.4% | 1.0% |
| Maximum | 12.1% | 30.8% |
| Range | 10.7% | 29.8% |
| Mean | 5.4% | 7.8% |
| Median | 5.0% | 5.3% |
| Interquartile 25% (IQ1) | 3.7% | 4.3% |
| Interquartile 75% (IQ3) | 6.0% | 9.0% |
| Interquartile Range (IQR) | 2.3% | 4.7% |
| Standard Deviation (Sample) | 2.9% | 6.1% |
| Standard Deviation (Population) | 2.8% | 6.1% |
Similar Demographics by No Vehicles in Household
Demographics Similar to Guamanians/Chamorros by No Vehicles in Household
In terms of no vehicles in household, the demographic groups most similar to Guamanians/Chamorros are Belgian (8.0%, a difference of 0.070%), Afghan (8.0%, a difference of 0.17%), Korean (8.0%, a difference of 0.17%), Northern European (7.9%, a difference of 0.65%), and Hawaiian (8.0%, a difference of 0.75%).
| Demographics | Rating | Rank | No Vehicles in Household |
| Swiss | 99.9 /100 | #42 | Exceptional 7.9% |
| Chickasaw | 99.9 /100 | #43 | Exceptional 7.9% |
| Choctaw | 99.9 /100 | #44 | Exceptional 7.9% |
| Immigrants | Nonimmigrants | 99.9 /100 | #45 | Exceptional 7.9% |
| Spanish | 99.9 /100 | #46 | Exceptional 7.9% |
| Northern Europeans | 99.9 /100 | #47 | Exceptional 7.9% |
| Afghans | 99.9 /100 | #48 | Exceptional 8.0% |
| Guamanians/Chamorros | 99.9 /100 | #49 | Exceptional 8.0% |
| Belgians | 99.9 /100 | #50 | Exceptional 8.0% |
| Koreans | 99.9 /100 | #51 | Exceptional 8.0% |
| Hawaiians | 99.9 /100 | #52 | Exceptional 8.0% |
| Slovenes | 99.9 /100 | #53 | Exceptional 8.0% |
| Immigrants | Venezuela | 99.9 /100 | #54 | Exceptional 8.1% |
| Celtics | 99.9 /100 | #55 | Exceptional 8.1% |
| Immigrants | Afghanistan | 99.9 /100 | #56 | Exceptional 8.1% |
Demographics Similar to English by No Vehicles in Household
In terms of no vehicles in household, the demographic groups most similar to English are Norwegian (6.4%, a difference of 1.1%), Danish (6.6%, a difference of 1.2%), Yakama (6.6%, a difference of 1.6%), German (6.7%, a difference of 2.6%), and Scottish (6.8%, a difference of 3.9%).
| Demographics | Rating | Rank | No Vehicles in Household |
| Luxembourgers | 100.0 /100 | #1 | Exceptional 5.4% |
| Norwegians | 100.0 /100 | #2 | Exceptional 6.4% |
| English | 100.0 /100 | #3 | Exceptional 6.5% |
| Danes | 100.0 /100 | #4 | Exceptional 6.6% |
| Yakama | 100.0 /100 | #5 | Exceptional 6.6% |
| Germans | 100.0 /100 | #6 | Exceptional 6.7% |
| Scottish | 100.0 /100 | #7 | Exceptional 6.8% |
| Swedes | 100.0 /100 | #8 | Exceptional 6.8% |
| Scotch-Irish | 100.0 /100 | #9 | Exceptional 6.8% |
| Dutch | 100.0 /100 | #10 | Exceptional 6.8% |
| Czechs | 100.0 /100 | #11 | Exceptional 6.9% |
| Assyrians/Chaldeans/Syriacs | 100.0 /100 | #12 | Exceptional 7.0% |
| Scandinavians | 100.0 /100 | #13 | Exceptional 7.0% |
| Mexicans | 100.0 /100 | #14 | Exceptional 7.0% |
| Whites/Caucasians | 100.0 /100 | #15 | Exceptional 7.0% |