Menominee vs Immigrants from Sudan No Vehicles in Household
COMPARE
Menominee
Immigrants from Sudan
No Vehicles in Household
No Vehicles in Household Comparison
Menominee
Immigrants from Sudan
11.8%
NO VEHICLES IN HOUSEHOLD
2.0/ 100
METRIC RATING
246th/ 347
METRIC RANK
10.4%
NO VEHICLES IN HOUSEHOLD
50.0/ 100
METRIC RATING
174th/ 347
METRIC RANK
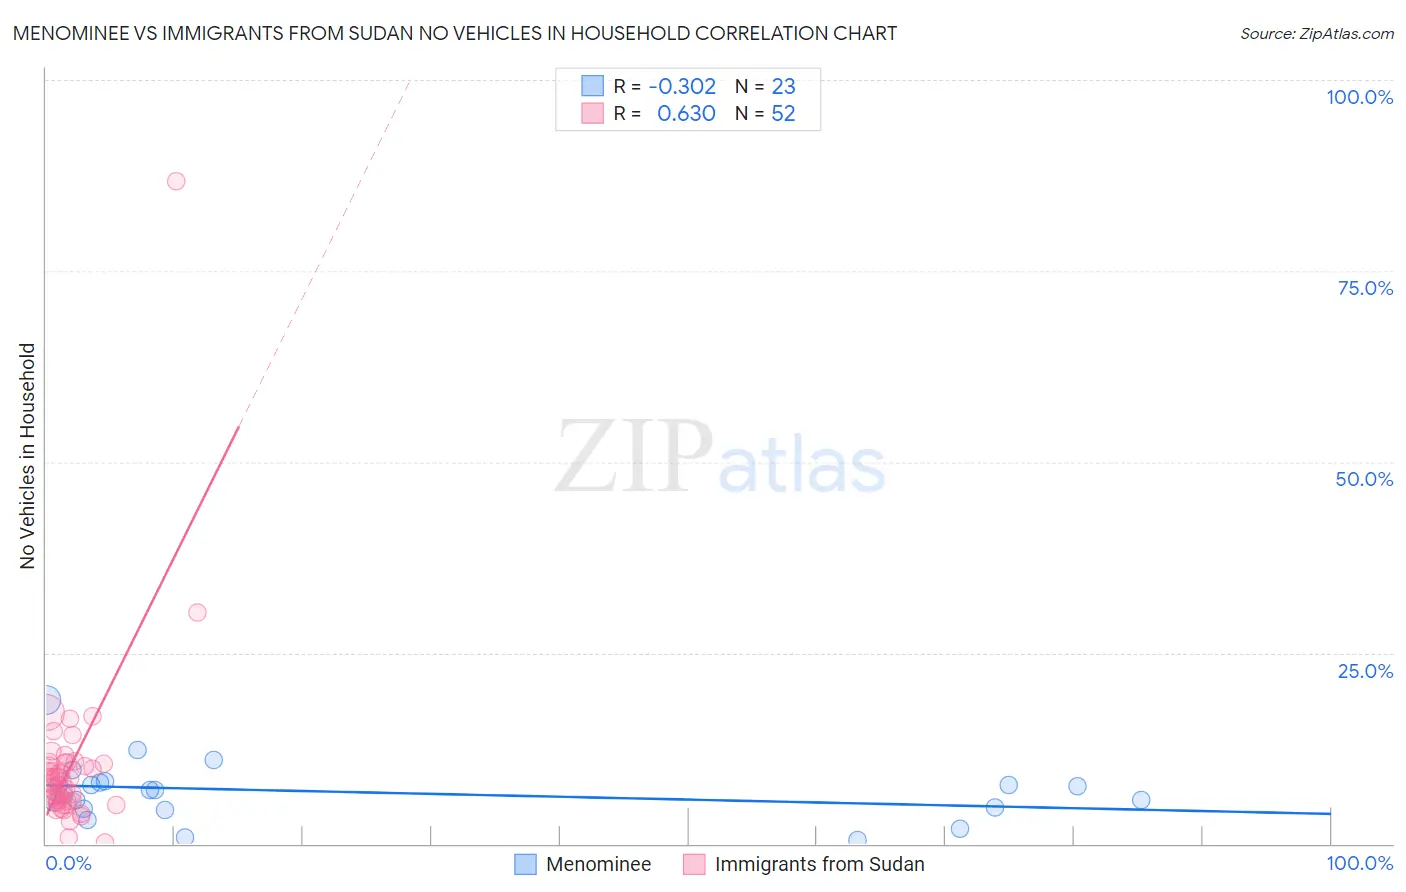
Menominee vs Immigrants from Sudan No Vehicles in Household Correlation Chart
The statistical analysis conducted on geographies consisting of 45,769,644 people shows a mild negative correlation between the proportion of Menominee and percentage of households with no vehicle available in the United States with a correlation coefficient (R) of -0.302 and weighted average of 11.8%. Similarly, the statistical analysis conducted on geographies consisting of 118,914,710 people shows a significant positive correlation between the proportion of Immigrants from Sudan and percentage of households with no vehicle available in the United States with a correlation coefficient (R) of 0.630 and weighted average of 10.4%, a difference of 13.2%.
No Vehicles in Household Correlation Summary
| Measurement | Menominee | Immigrants from Sudan |
| Minimum | 0.55% | 0.089% |
| Maximum | 18.9% | 86.7% |
| Range | 18.3% | 86.6% |
| Mean | 6.8% | 10.0% |
| Median | 7.0% | 8.3% |
| Interquartile 25% (IQ1) | 4.5% | 5.6% |
| Interquartile 75% (IQ3) | 8.1% | 10.5% |
| Interquartile Range (IQR) | 3.5% | 5.0% |
| Standard Deviation (Sample) | 3.9% | 11.8% |
| Standard Deviation (Population) | 3.8% | 11.7% |
Similar Demographics by No Vehicles in Household
Demographics Similar to Menominee by No Vehicles in Household
In terms of no vehicles in household, the demographic groups most similar to Menominee are Immigrants from Czechoslovakia (11.8%, a difference of 0.050%), Immigrants from Belgium (11.8%, a difference of 0.060%), Immigrants from Nigeria (11.8%, a difference of 0.10%), Immigrants from Honduras (11.8%, a difference of 0.17%), and Paiute (11.8%, a difference of 0.32%).
| Demographics | Rating | Rank | No Vehicles in Household |
| Taiwanese | 2.8 /100 | #239 | Tragic 11.7% |
| Immigrants | Immigrants | 2.7 /100 | #240 | Tragic 11.7% |
| Eastern Europeans | 2.7 /100 | #241 | Tragic 11.7% |
| Turks | 2.6 /100 | #242 | Tragic 11.7% |
| Cheyenne | 2.4 /100 | #243 | Tragic 11.7% |
| Immigrants | Portugal | 2.2 /100 | #244 | Tragic 11.7% |
| Immigrants | Honduras | 2.1 /100 | #245 | Tragic 11.8% |
| Menominee | 2.0 /100 | #246 | Tragic 11.8% |
| Immigrants | Czechoslovakia | 2.0 /100 | #247 | Tragic 11.8% |
| Immigrants | Belgium | 1.9 /100 | #248 | Tragic 11.8% |
| Immigrants | Nigeria | 1.9 /100 | #249 | Tragic 11.8% |
| Paiute | 1.8 /100 | #250 | Tragic 11.8% |
| Blacks/African Americans | 1.6 /100 | #251 | Tragic 11.9% |
| Immigrants | Serbia | 1.5 /100 | #252 | Tragic 11.9% |
| Egyptians | 1.4 /100 | #253 | Tragic 11.9% |
Demographics Similar to Immigrants from Sudan by No Vehicles in Household
In terms of no vehicles in household, the demographic groups most similar to Immigrants from Sudan are Filipino (10.4%, a difference of 0.010%), Immigrants from Burma/Myanmar (10.4%, a difference of 0.12%), French American Indian (10.4%, a difference of 0.12%), Immigrants from El Salvador (10.4%, a difference of 0.13%), and Brazilian (10.4%, a difference of 0.23%).
| Demographics | Rating | Rank | No Vehicles in Household |
| Immigrants | Saudi Arabia | 58.8 /100 | #167 | Average 10.3% |
| Indonesians | 56.7 /100 | #168 | Average 10.3% |
| Lumbee | 54.7 /100 | #169 | Average 10.3% |
| Immigrants | Latin America | 53.2 /100 | #170 | Average 10.4% |
| Hmong | 52.7 /100 | #171 | Average 10.4% |
| Brazilians | 51.7 /100 | #172 | Average 10.4% |
| Filipinos | 50.1 /100 | #173 | Average 10.4% |
| Immigrants | Sudan | 50.0 /100 | #174 | Average 10.4% |
| Immigrants | Burma/Myanmar | 49.1 /100 | #175 | Average 10.4% |
| French American Indians | 49.1 /100 | #176 | Average 10.4% |
| Immigrants | El Salvador | 49.1 /100 | #177 | Average 10.4% |
| Immigrants | Ethiopia | 48.0 /100 | #178 | Average 10.4% |
| Ethiopians | 45.8 /100 | #179 | Average 10.5% |
| Arabs | 45.3 /100 | #180 | Average 10.5% |
| Immigrants | Colombia | 44.1 /100 | #181 | Average 10.5% |