Immigrants from Russia vs Immigrants from Sudan No Vehicles in Household
COMPARE
Immigrants from Russia
Immigrants from Sudan
No Vehicles in Household
No Vehicles in Household Comparison
Immigrants from Russia
Immigrants from Sudan
15.1%
NO VEHICLES IN HOUSEHOLD
0.0/ 100
METRIC RATING
304th/ 347
METRIC RANK
10.4%
NO VEHICLES IN HOUSEHOLD
50.0/ 100
METRIC RATING
174th/ 347
METRIC RANK
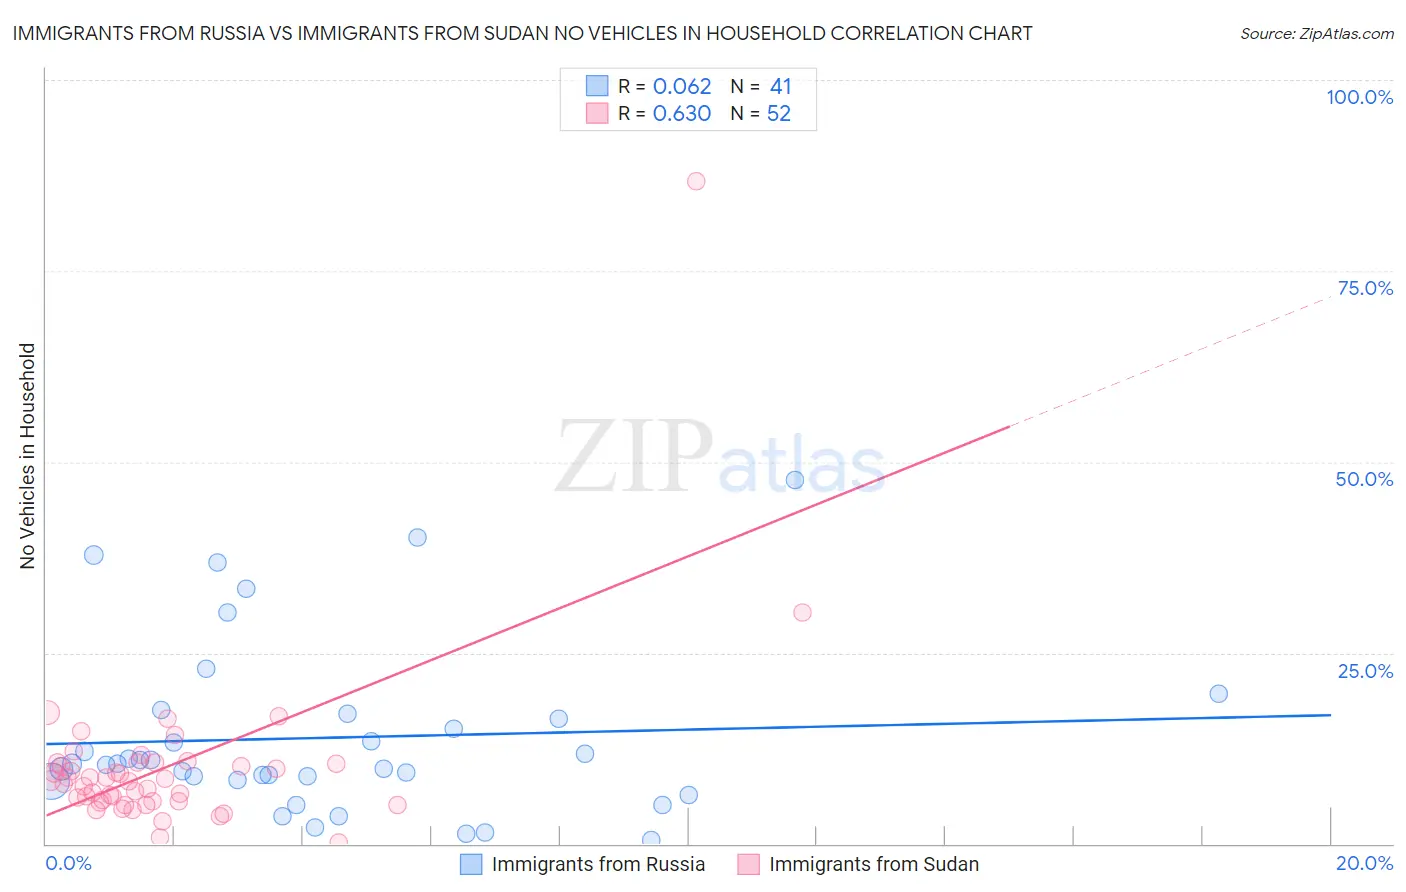
Immigrants from Russia vs Immigrants from Sudan No Vehicles in Household Correlation Chart
The statistical analysis conducted on geographies consisting of 347,176,226 people shows a slight positive correlation between the proportion of Immigrants from Russia and percentage of households with no vehicle available in the United States with a correlation coefficient (R) of 0.062 and weighted average of 15.1%. Similarly, the statistical analysis conducted on geographies consisting of 118,914,710 people shows a significant positive correlation between the proportion of Immigrants from Sudan and percentage of households with no vehicle available in the United States with a correlation coefficient (R) of 0.630 and weighted average of 10.4%, a difference of 45.1%.
No Vehicles in Household Correlation Summary
| Measurement | Immigrants from Russia | Immigrants from Sudan |
| Minimum | 0.41% | 0.089% |
| Maximum | 47.6% | 86.7% |
| Range | 47.2% | 86.6% |
| Mean | 13.9% | 10.0% |
| Median | 10.4% | 8.3% |
| Interquartile 25% (IQ1) | 8.3% | 5.6% |
| Interquartile 75% (IQ3) | 16.7% | 10.5% |
| Interquartile Range (IQR) | 8.5% | 5.0% |
| Standard Deviation (Sample) | 11.3% | 11.8% |
| Standard Deviation (Population) | 11.1% | 11.7% |
Similar Demographics by No Vehicles in Household
Demographics Similar to Immigrants from Russia by No Vehicles in Household
In terms of no vehicles in household, the demographic groups most similar to Immigrants from Russia are Immigrants from China (15.2%, a difference of 0.38%), Immigrants from Western Africa (15.0%, a difference of 0.66%), Haitian (14.9%, a difference of 1.2%), Immigrants from Ukraine (14.9%, a difference of 1.7%), and Yuman (14.9%, a difference of 1.7%).
| Demographics | Rating | Rank | No Vehicles in Household |
| Immigrants | Panama | 0.0 /100 | #297 | Tragic 14.6% |
| Moroccans | 0.0 /100 | #298 | Tragic 14.7% |
| Immigrants | Greece | 0.0 /100 | #299 | Tragic 14.7% |
| Yuman | 0.0 /100 | #300 | Tragic 14.9% |
| Immigrants | Ukraine | 0.0 /100 | #301 | Tragic 14.9% |
| Haitians | 0.0 /100 | #302 | Tragic 14.9% |
| Immigrants | Western Africa | 0.0 /100 | #303 | Tragic 15.0% |
| Immigrants | Russia | 0.0 /100 | #304 | Tragic 15.1% |
| Immigrants | China | 0.0 /100 | #305 | Tragic 15.2% |
| Immigrants | Belize | 0.0 /100 | #306 | Tragic 15.4% |
| Immigrants | Haiti | 0.0 /100 | #307 | Tragic 15.4% |
| U.S. Virgin Islanders | 0.0 /100 | #308 | Tragic 15.4% |
| Puerto Ricans | 0.0 /100 | #309 | Tragic 15.5% |
| Cape Verdeans | 0.0 /100 | #310 | Tragic 15.6% |
| Immigrants | Israel | 0.0 /100 | #311 | Tragic 15.6% |
Demographics Similar to Immigrants from Sudan by No Vehicles in Household
In terms of no vehicles in household, the demographic groups most similar to Immigrants from Sudan are Filipino (10.4%, a difference of 0.010%), Immigrants from Burma/Myanmar (10.4%, a difference of 0.12%), French American Indian (10.4%, a difference of 0.12%), Immigrants from El Salvador (10.4%, a difference of 0.13%), and Brazilian (10.4%, a difference of 0.23%).
| Demographics | Rating | Rank | No Vehicles in Household |
| Immigrants | Saudi Arabia | 58.8 /100 | #167 | Average 10.3% |
| Indonesians | 56.7 /100 | #168 | Average 10.3% |
| Lumbee | 54.7 /100 | #169 | Average 10.3% |
| Immigrants | Latin America | 53.2 /100 | #170 | Average 10.4% |
| Hmong | 52.7 /100 | #171 | Average 10.4% |
| Brazilians | 51.7 /100 | #172 | Average 10.4% |
| Filipinos | 50.1 /100 | #173 | Average 10.4% |
| Immigrants | Sudan | 50.0 /100 | #174 | Average 10.4% |
| Immigrants | Burma/Myanmar | 49.1 /100 | #175 | Average 10.4% |
| French American Indians | 49.1 /100 | #176 | Average 10.4% |
| Immigrants | El Salvador | 49.1 /100 | #177 | Average 10.4% |
| Immigrants | Ethiopia | 48.0 /100 | #178 | Average 10.4% |
| Ethiopians | 45.8 /100 | #179 | Average 10.5% |
| Arabs | 45.3 /100 | #180 | Average 10.5% |
| Immigrants | Colombia | 44.1 /100 | #181 | Average 10.5% |