Guamanian/Chamorro vs Spanish American No Vehicles in Household
COMPARE
Guamanian/Chamorro
Spanish American
No Vehicles in Household
No Vehicles in Household Comparison
Guamanians/Chamorros
Spanish Americans
8.0%
NO VEHICLES IN HOUSEHOLD
99.9/ 100
METRIC RATING
49th/ 347
METRIC RANK
9.1%
NO VEHICLES IN HOUSEHOLD
97.9/ 100
METRIC RATING
105th/ 347
METRIC RANK
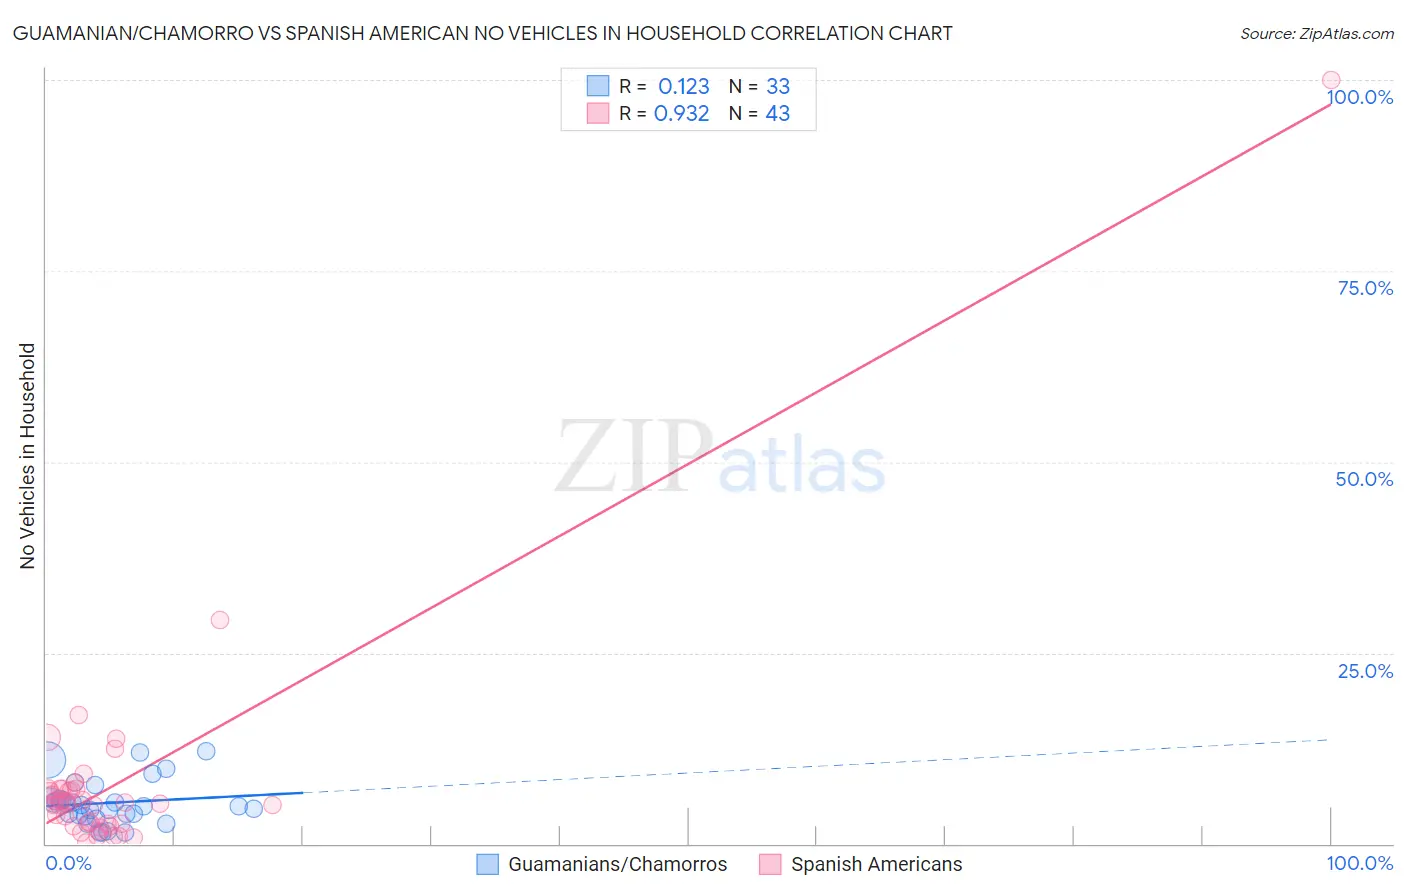
Guamanian/Chamorro vs Spanish American No Vehicles in Household Correlation Chart
The statistical analysis conducted on geographies consisting of 221,696,459 people shows a poor positive correlation between the proportion of Guamanians/Chamorros and percentage of households with no vehicle available in the United States with a correlation coefficient (R) of 0.123 and weighted average of 8.0%. Similarly, the statistical analysis conducted on geographies consisting of 103,117,894 people shows a near-perfect positive correlation between the proportion of Spanish Americans and percentage of households with no vehicle available in the United States with a correlation coefficient (R) of 0.932 and weighted average of 9.1%, a difference of 13.4%.
No Vehicles in Household Correlation Summary
| Measurement | Guamanian/Chamorro | Spanish American |
| Minimum | 1.4% | 0.089% |
| Maximum | 12.1% | 100.0% |
| Range | 10.7% | 99.9% |
| Mean | 5.4% | 8.1% |
| Median | 5.0% | 5.3% |
| Interquartile 25% (IQ1) | 3.7% | 2.6% |
| Interquartile 75% (IQ3) | 6.0% | 7.1% |
| Interquartile Range (IQR) | 2.3% | 4.6% |
| Standard Deviation (Sample) | 2.9% | 15.2% |
| Standard Deviation (Population) | 2.8% | 15.1% |
Similar Demographics by No Vehicles in Household
Demographics Similar to Guamanians/Chamorros by No Vehicles in Household
In terms of no vehicles in household, the demographic groups most similar to Guamanians/Chamorros are Belgian (8.0%, a difference of 0.070%), Afghan (8.0%, a difference of 0.17%), Korean (8.0%, a difference of 0.17%), Northern European (7.9%, a difference of 0.65%), and Hawaiian (8.0%, a difference of 0.75%).
| Demographics | Rating | Rank | No Vehicles in Household |
| Swiss | 99.9 /100 | #42 | Exceptional 7.9% |
| Chickasaw | 99.9 /100 | #43 | Exceptional 7.9% |
| Choctaw | 99.9 /100 | #44 | Exceptional 7.9% |
| Immigrants | Nonimmigrants | 99.9 /100 | #45 | Exceptional 7.9% |
| Spanish | 99.9 /100 | #46 | Exceptional 7.9% |
| Northern Europeans | 99.9 /100 | #47 | Exceptional 7.9% |
| Afghans | 99.9 /100 | #48 | Exceptional 8.0% |
| Guamanians/Chamorros | 99.9 /100 | #49 | Exceptional 8.0% |
| Belgians | 99.9 /100 | #50 | Exceptional 8.0% |
| Koreans | 99.9 /100 | #51 | Exceptional 8.0% |
| Hawaiians | 99.9 /100 | #52 | Exceptional 8.0% |
| Slovenes | 99.9 /100 | #53 | Exceptional 8.0% |
| Immigrants | Venezuela | 99.9 /100 | #54 | Exceptional 8.1% |
| Celtics | 99.9 /100 | #55 | Exceptional 8.1% |
| Immigrants | Afghanistan | 99.9 /100 | #56 | Exceptional 8.1% |
Demographics Similar to Spanish Americans by No Vehicles in Household
In terms of no vehicles in household, the demographic groups most similar to Spanish Americans are Laotian (9.1%, a difference of 0.090%), Zimbabwean (9.0%, a difference of 0.16%), Hispanic or Latino (9.1%, a difference of 0.36%), Mexican American Indian (9.1%, a difference of 0.44%), and Maltese (9.1%, a difference of 0.57%).
| Demographics | Rating | Rank | No Vehicles in Household |
| Slavs | 98.4 /100 | #98 | Exceptional 9.0% |
| Bulgarians | 98.4 /100 | #99 | Exceptional 9.0% |
| Asians | 98.3 /100 | #100 | Exceptional 9.0% |
| Pakistanis | 98.3 /100 | #101 | Exceptional 9.0% |
| Yugoslavians | 98.3 /100 | #102 | Exceptional 9.0% |
| Seminole | 98.3 /100 | #103 | Exceptional 9.0% |
| Zimbabweans | 98.0 /100 | #104 | Exceptional 9.0% |
| Spanish Americans | 97.9 /100 | #105 | Exceptional 9.1% |
| Laotians | 97.8 /100 | #106 | Exceptional 9.1% |
| Hispanics or Latinos | 97.7 /100 | #107 | Exceptional 9.1% |
| Mexican American Indians | 97.6 /100 | #108 | Exceptional 9.1% |
| Maltese | 97.6 /100 | #109 | Exceptional 9.1% |
| Delaware | 97.2 /100 | #110 | Exceptional 9.2% |
| Immigrants | Kuwait | 95.1 /100 | #111 | Exceptional 9.4% |
| Armenians | 95.0 /100 | #112 | Exceptional 9.4% |