Guamanian/Chamorro vs Immigrants from Australia No Vehicles in Household
COMPARE
Guamanian/Chamorro
Immigrants from Australia
No Vehicles in Household
No Vehicles in Household Comparison
Guamanians/Chamorros
Immigrants from Australia
8.0%
NO VEHICLES IN HOUSEHOLD
99.9/ 100
METRIC RATING
49th/ 347
METRIC RANK
13.8%
NO VEHICLES IN HOUSEHOLD
0.0/ 100
METRIC RATING
289th/ 347
METRIC RANK
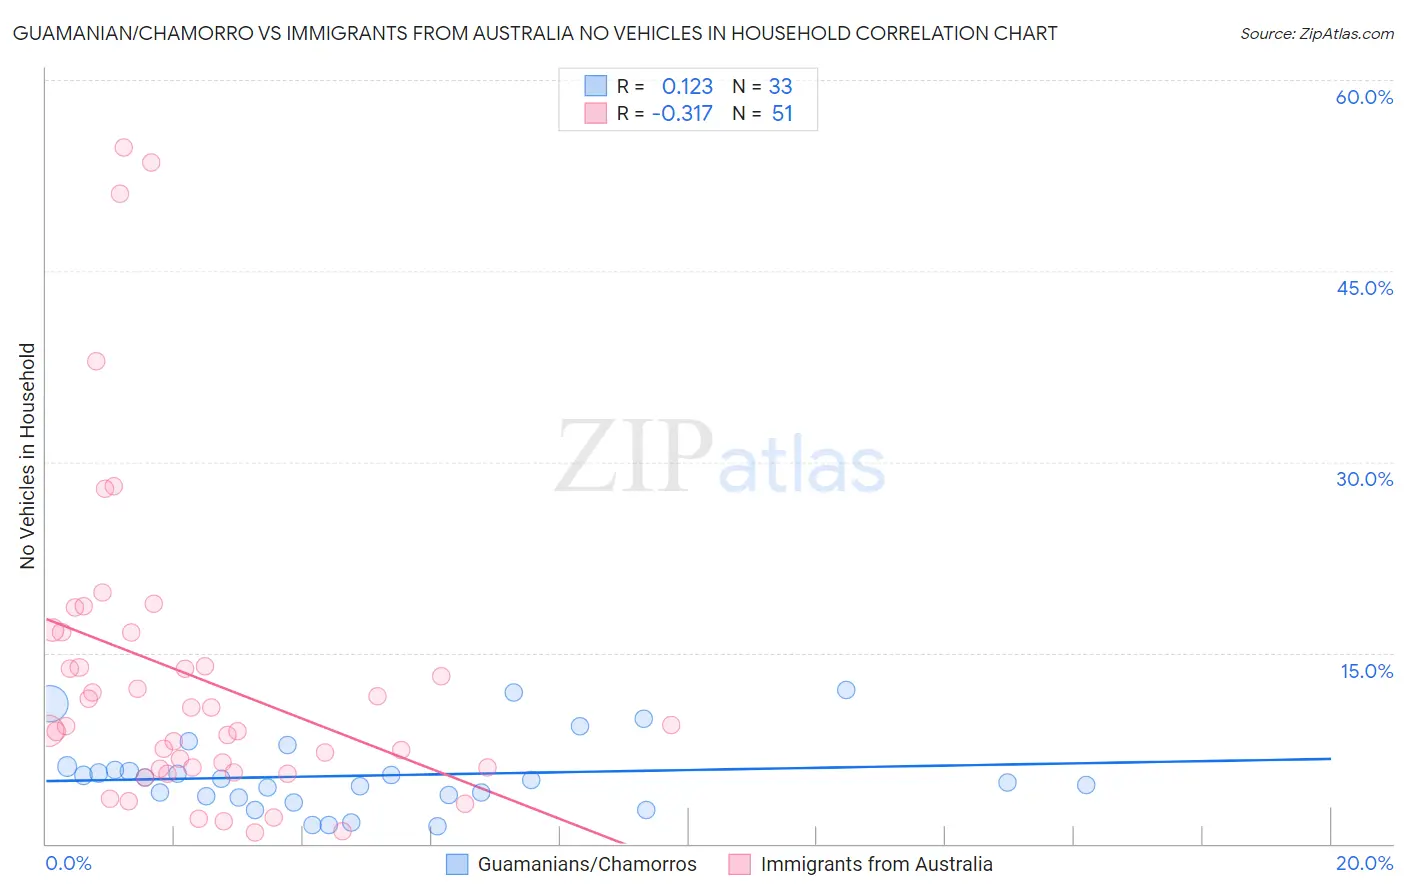
Guamanian/Chamorro vs Immigrants from Australia No Vehicles in Household Correlation Chart
The statistical analysis conducted on geographies consisting of 221,696,459 people shows a poor positive correlation between the proportion of Guamanians/Chamorros and percentage of households with no vehicle available in the United States with a correlation coefficient (R) of 0.123 and weighted average of 8.0%. Similarly, the statistical analysis conducted on geographies consisting of 226,784,291 people shows a mild negative correlation between the proportion of Immigrants from Australia and percentage of households with no vehicle available in the United States with a correlation coefficient (R) of -0.317 and weighted average of 13.8%, a difference of 73.2%.
No Vehicles in Household Correlation Summary
| Measurement | Guamanian/Chamorro | Immigrants from Australia |
| Minimum | 1.4% | 0.88% |
| Maximum | 12.1% | 54.7% |
| Range | 10.7% | 53.8% |
| Mean | 5.4% | 13.1% |
| Median | 5.0% | 9.3% |
| Interquartile 25% (IQ1) | 3.7% | 5.9% |
| Interquartile 75% (IQ3) | 6.0% | 16.6% |
| Interquartile Range (IQR) | 2.3% | 10.7% |
| Standard Deviation (Sample) | 2.9% | 12.4% |
| Standard Deviation (Population) | 2.8% | 12.3% |
Similar Demographics by No Vehicles in Household
Demographics Similar to Guamanians/Chamorros by No Vehicles in Household
In terms of no vehicles in household, the demographic groups most similar to Guamanians/Chamorros are Belgian (8.0%, a difference of 0.070%), Afghan (8.0%, a difference of 0.17%), Korean (8.0%, a difference of 0.17%), Northern European (7.9%, a difference of 0.65%), and Hawaiian (8.0%, a difference of 0.75%).
| Demographics | Rating | Rank | No Vehicles in Household |
| Swiss | 99.9 /100 | #42 | Exceptional 7.9% |
| Chickasaw | 99.9 /100 | #43 | Exceptional 7.9% |
| Choctaw | 99.9 /100 | #44 | Exceptional 7.9% |
| Immigrants | Nonimmigrants | 99.9 /100 | #45 | Exceptional 7.9% |
| Spanish | 99.9 /100 | #46 | Exceptional 7.9% |
| Northern Europeans | 99.9 /100 | #47 | Exceptional 7.9% |
| Afghans | 99.9 /100 | #48 | Exceptional 8.0% |
| Guamanians/Chamorros | 99.9 /100 | #49 | Exceptional 8.0% |
| Belgians | 99.9 /100 | #50 | Exceptional 8.0% |
| Koreans | 99.9 /100 | #51 | Exceptional 8.0% |
| Hawaiians | 99.9 /100 | #52 | Exceptional 8.0% |
| Slovenes | 99.9 /100 | #53 | Exceptional 8.0% |
| Immigrants | Venezuela | 99.9 /100 | #54 | Exceptional 8.1% |
| Celtics | 99.9 /100 | #55 | Exceptional 8.1% |
| Immigrants | Afghanistan | 99.9 /100 | #56 | Exceptional 8.1% |
Demographics Similar to Immigrants from Australia by No Vehicles in Household
In terms of no vehicles in household, the demographic groups most similar to Immigrants from Australia are Hopi (13.7%, a difference of 0.66%), Immigrants from Ireland (13.7%, a difference of 0.80%), Colville (13.7%, a difference of 1.0%), Immigrants from Eastern Europe (13.6%, a difference of 1.7%), and Immigrants from Malaysia (13.6%, a difference of 1.7%).
| Demographics | Rating | Rank | No Vehicles in Household |
| Immigrants | Eastern Asia | 0.0 /100 | #282 | Tragic 13.5% |
| Immigrants | Kazakhstan | 0.0 /100 | #283 | Tragic 13.6% |
| Immigrants | Malaysia | 0.0 /100 | #284 | Tragic 13.6% |
| Immigrants | Eastern Europe | 0.0 /100 | #285 | Tragic 13.6% |
| Colville | 0.0 /100 | #286 | Tragic 13.7% |
| Immigrants | Ireland | 0.0 /100 | #287 | Tragic 13.7% |
| Hopi | 0.0 /100 | #288 | Tragic 13.7% |
| Immigrants | Australia | 0.0 /100 | #289 | Tragic 13.8% |
| Indians (Asian) | 0.0 /100 | #290 | Tragic 14.1% |
| Okinawans | 0.0 /100 | #291 | Tragic 14.1% |
| Pima | 0.0 /100 | #292 | Tragic 14.1% |
| Immigrants | Jamaica | 0.0 /100 | #293 | Tragic 14.2% |
| Belizeans | 0.0 /100 | #294 | Tragic 14.3% |
| Paraguayans | 0.0 /100 | #295 | Tragic 14.4% |
| Immigrants | Spain | 0.0 /100 | #296 | Tragic 14.5% |